The Piri Reis Map
In 1513 an Ottoman admiral compiled a chart of the Atlantic from about twenty older maps, one of them Columbus's own; in 1929 it surfaced in a palace library; and in 1956 a radio broadcast turned its bottom edge into the most famous coastline in alternative history: Antarctica, allegedly, mapped before the ice. An Air Force letter agreed 'very remarkably'; a bestseller opened with it; a scholarly edition dismantled it. Almost everything in that dispute is computable, which is rare and precious in this field. So this instrument computes it: the projection, the fits, the missing strait, the age of the ice, all live, all sourced, with the strong words left to the people who said them.
 Open the interactive ▸
 What you're looking at
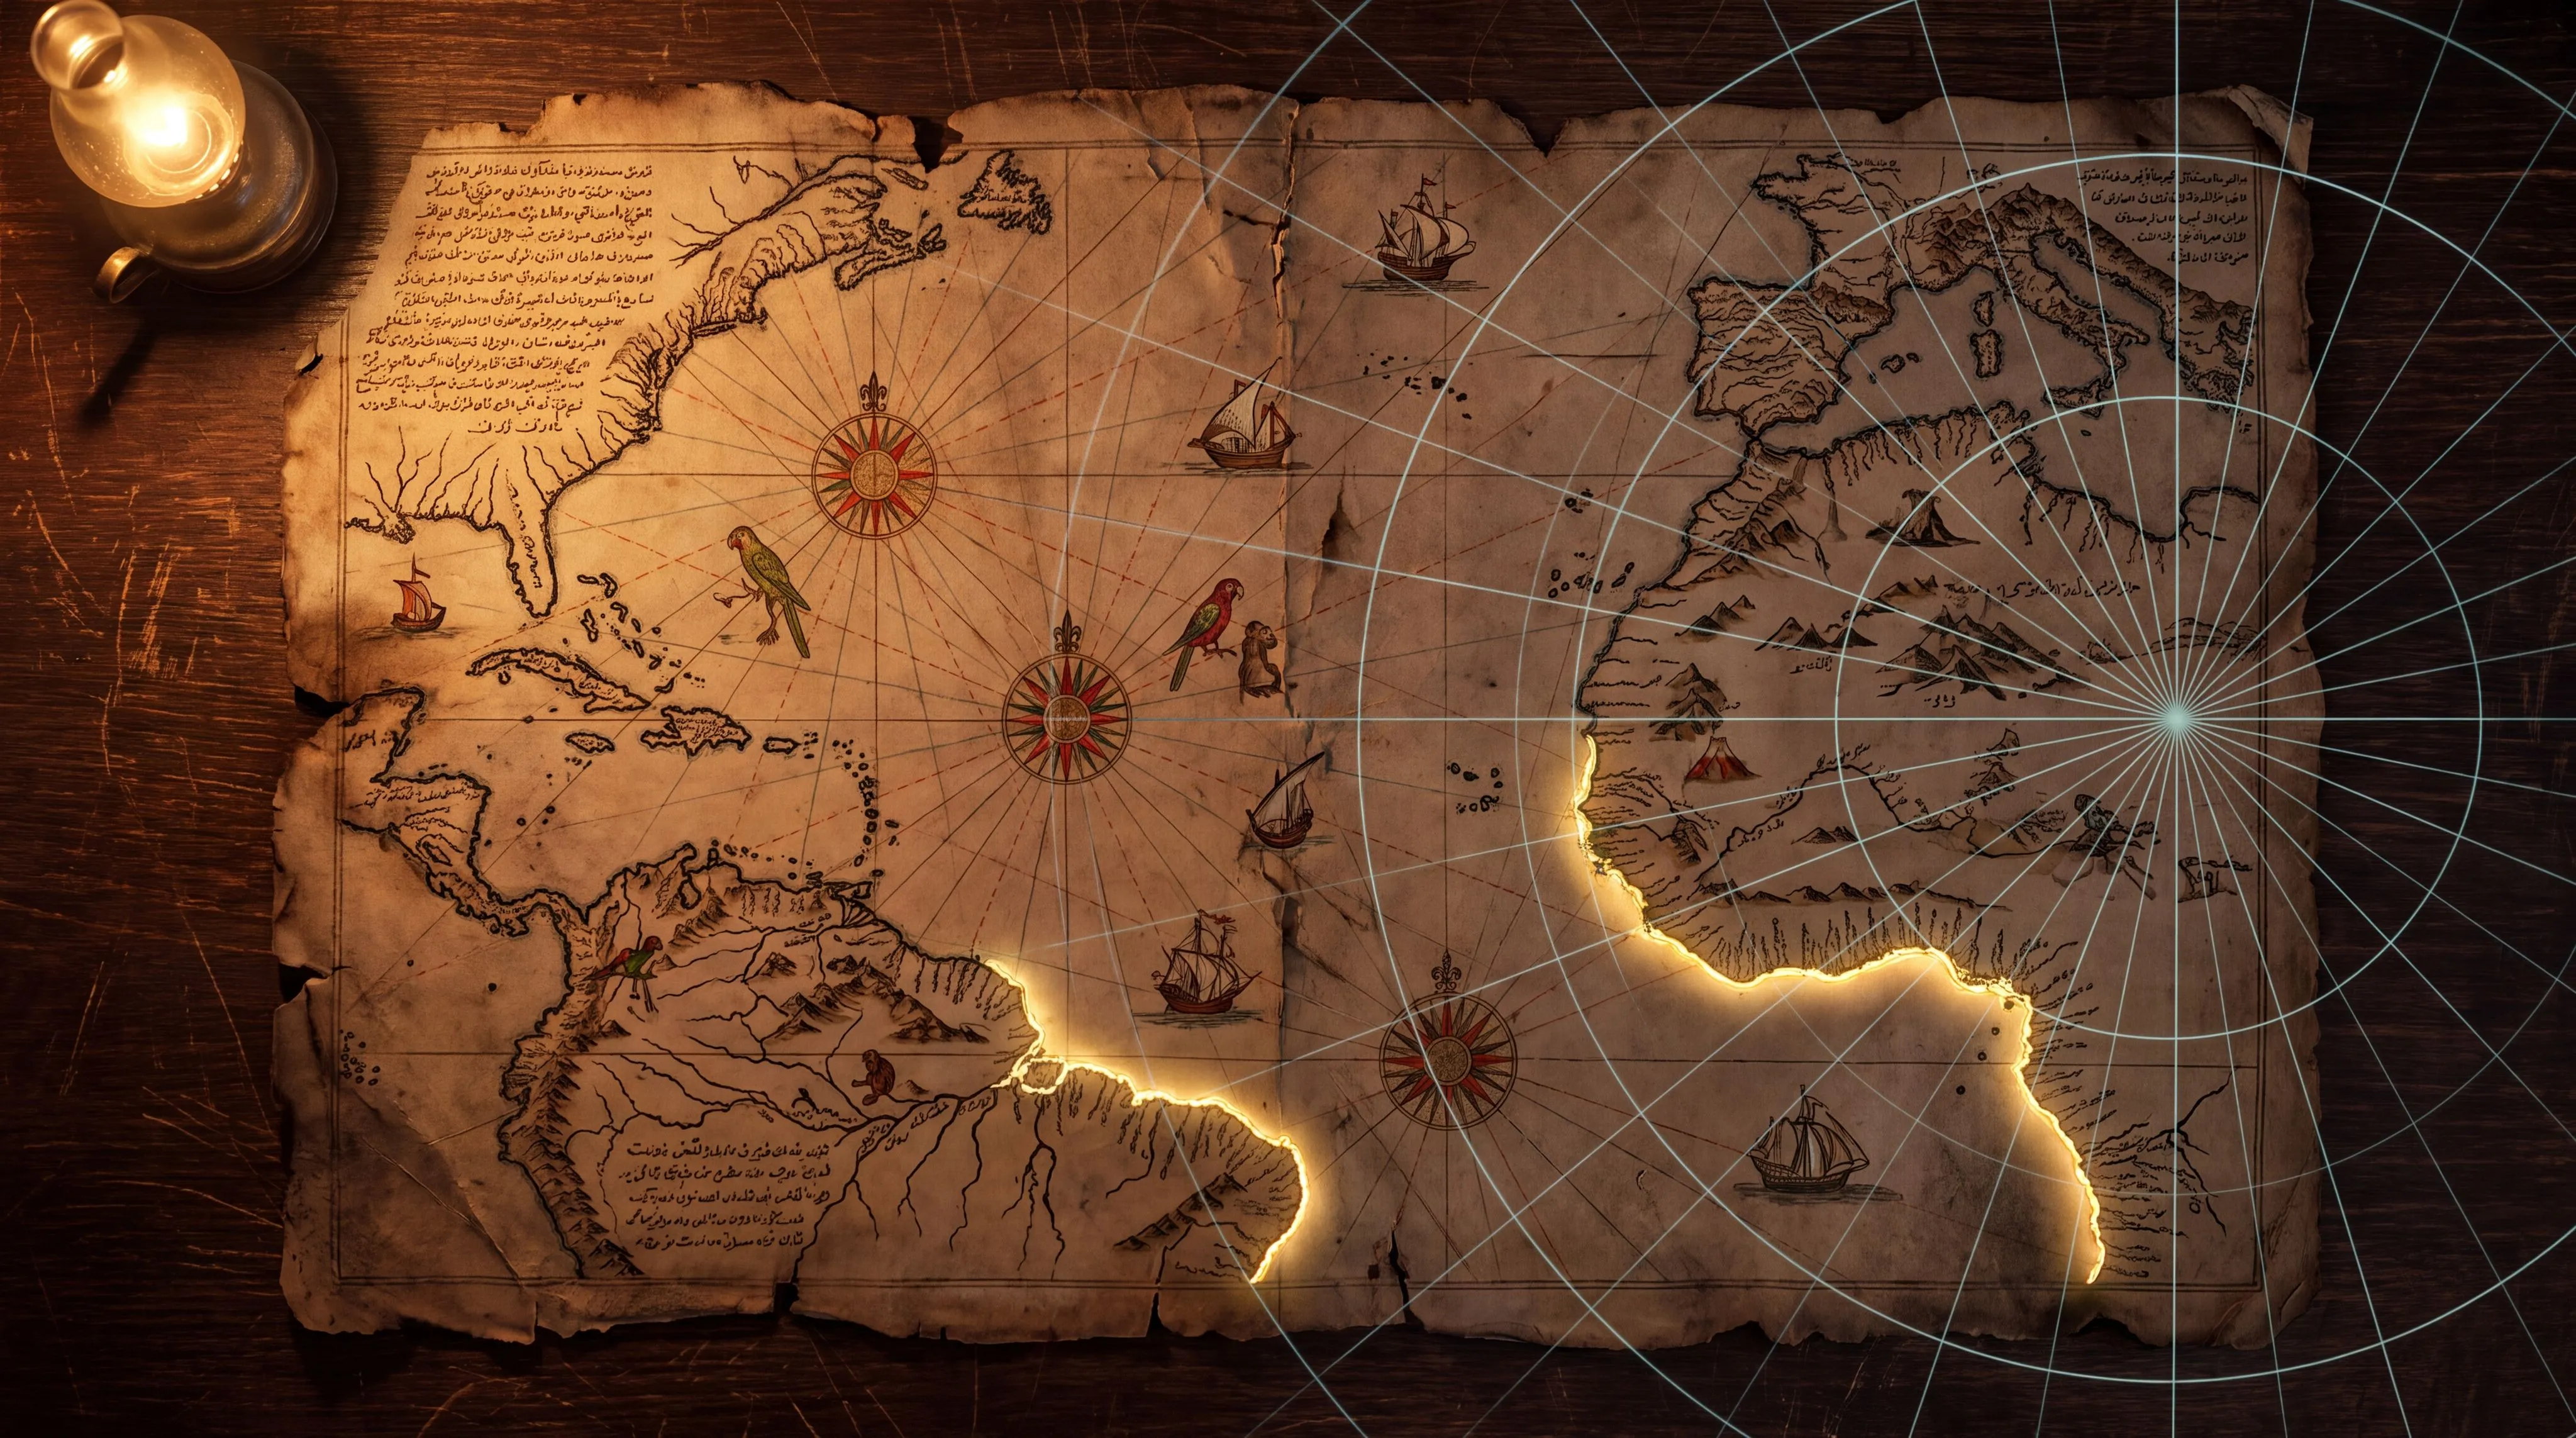
The Chart view redraws the fragment: the parchment's torn outline, the windroses and rhumb lines, the Caribbean as Columbus imagined it, the Brazilian coast, and along the bottom the gold coastline the whole dispute stands on. Every ¶ mark is one of Piri's actual marginal notes, including the one where he lists his sources and the one describing the southern land as a hot country with big snakes. A reading switch redraws the labels through Hapgood's eyes or McIntosh's.
The Projection view is the claim's own machine, honestly built: an azimuthal equidistant projection of the real Earth about any centre you choose, with Hapgood's Egypt as a preset. Distance rings and the hover readout print the two quantities the projection keeps true. The dashed box is the fragment's window; a second toggle overlays the windrose skeleton, the geometry the chart actually wears, so the two constructions can be compared on one disc.
The Southern Land view is the trial. The map's southern coast, digitised, is fitted by least squares, scale, rotation and position free, onto three candidates: the subglacial Queen Maud coast the claim wants, the modern ice edge as a control, and the sceptics' Patagonia bent east. RMS prints live per lane; a jitter button re-traces the map coast to show what the tracing is worth; and the Drake Passage card draws the 800 km of ocean the chart does not have.
The File view is the paper trail: 1513 to 2000 on a broken axis with a 370-year silence in the middle, then the cards: Mallery's broadcast, the Ohlmeyer letter, Piri's bibliography, the ice-core clock, and the two verdicts, Hapgood's and McIntosh's, at equal size. Click any card for the full story with its sourcing.
Why it's here
On this site's culture shelf stands a book: Fingerprints of the Gods, Hancock's 1995 bestseller. Its first chapter is not about pyramids or the Maya; it is about a letter. In 1960, officers of the USAF's 8th Reconnaissance Technical Squadron wrote to a teacher named Charles Hapgood that the lower coast of a 1513 Ottoman chart "agrees very remarkably" with the seismic profile of the coast beneath the Queen Maud Land ice, and seemed to have been mapped before the ice covered it. The whole case for a lost civilisation steps off from that gazelle skin. And the skin is real: it lies in Topkapi Palace, signed by Piri, son of Hajji Mehmed, with its own bibliography written in the margins, one entry of which descends from Columbus.
Hence this instrument. Like its sibling INST-35 Precession & the Orion Correlation, it is a bench built for another of the same book's central claims, and the second instrument on this site's archaeoastronomy and cartography line. Every computable part of the claim is built as a machine: the azimuthal equidistant projection is exact by construction, its centre free to stand at Cairo or anywhere else; the disputed coast is handed to least squares with three candidates fitted live and RMS printed; the Drake Passage gap, the twice-drawn Amazon and the missing nine hundred miles all go on the table; and the age of the ice stands as the one clock nobody has moved. Hapgood's and McIntosh's verdict cards hang in the file view at equal size. It does not rule on what the coast is. It computes everything computable, and hands the reading back to you.
How it works
Two pieces of exact mathematics run the whole bench: a projection and a fit. Everything else is bookkeeping against them, and every number on screen computes live.
x = c·R·sin A · y = −c·R·cos A · about any centre · fit: min Σ|sRθ·aᵢ + t − bᵢ|² · RMS in km
The projection is exact. For any centre, each point's angular distance c and azimuth A are computed spherically and plotted at radius c·R along bearing A. Distance and bearing from the centre are then true by construction, the property the whole 'ancient projection' claim invokes, and everything else distorts, which is the property the claim tends not to mention. The bench draws both.
The trial is a similarity fit. The digitised map coast and each candidate are resampled to 48 points by arc length; least squares finds the scale, rotation and translation (no mirror) that best lays the trace on the candidate; the residual prints as RMS in the candidate's own kilometres and as a share of coast length. Both coast directions are tried and the better one kept. A fit this generous is deliberate: a claim that cannot win here cannot win.
The control does the teaching. The modern ice coast is fitted alongside, though nobody's theory predicts the 1513 chart should match it. When the control lands within the same few hundred kilometres as the star candidate, the star's 'remarkable agreement' is revealed as the default performance of any wiggly line at this resolution, which is the bench's central honest lesson.
The jitter button audits the tracing. The map coast is a hand trace of a 500-year-old drawing, so the trace is itself a source of error. Jitter redraws it within an honest tolerance and reruns all three fits. Conclusions that survive are about the coasts; conclusions that do not are about the tracing, and the bench says so on the button.
And the clock is not part of the geometry. The ice chronology, a sheet ~34 million years old, a core continuous through ~800,000, enters as measured numbers with sources, not as a model. It is the one part of the dispute that no fit, no projection and no reading has ever moved, and the file view gives it its own card.
The projection mathematics and the fits are exact; the coastlines are public data; the chart redrawing and the two hand traces are disclosed models with an audit button wired to them; and every quoted phrase, 'agrees very remarkably', 'a hot country', 'a masterpiece of its own century', belongs to its speaker. What precession was to INST-35, projection is here: mathematics nobody disputes, read three different ways. Whether the coast at the bottom of the skin is Antarctica is not a question this instrument answers. It is the question it equips.
Six places to stand
Each is a real position in the dispute, with the dials set where it is worth standing.
- The signature. Chart view: click the ¶ by the lower left edge. Piri, son of Hajji Mehmed, Gallipoli, 919 AH, presented to Selim I at Cairo in 1517. The object is real and superbly documented, which is what makes the dispute worth having.
- The bibliography. The ¶ off the African coast: about twenty charts, eight Ptolemaic, four Portuguese, one Columbus. The sceptics' entire case in one marginal note, written by the mapmaker himself.
- Cairo. Projection view, the airmen's preset. Distance and bearing spread true from Egypt, the fragment's window sits comfortably in the disc, and Queen Maud Land smears along the far rim 11,400 km out, nowhere near where the parchment draws its southern coast.
- The North Pole. The same machine centred where the UN emblem centres it. Nothing about an azimuthal equidistant world requires lost ancients; you have been carrying one in your pocket on every UN document you have ever seen.
- The trial. Southern Land view, all three candidates on. Read the three RMS numbers, then press jitter a few times. The point is not which lane wins; the point is how close together they finish, every time.
- The verdicts. File view. One letter, one broadcast, one bibliography, one clock of ice, and two cards the same size. The site's whole method in a single screen.
The readings, as they stand
Four claims stacked from bedrock to speculation, with who argues each and where it lands. Two are settled, one is the dispute this bench is built for, and one is the sweeping reading this instrument declines to endorse.
| The chart is genuine, drawn 1513 by Piri Reis argued by Undisputed since the 1929 identification (Kahle, Halil Edhem) | LEADING | Settled. Signed, dated 919 AH, on gazelle skin, by one of the century's best-documented chartmakers, author of the Kitab-i Bahriye. Nothing in the dispute questions the object; everything questions what it descends from. |
| It preserves an echo of Columbus's lost chart argued by Kahle 1933; the 1929 sensation; accepted by McIntosh | LEADING | The mainstream's own treasure. Piri's margins say a source map came from Columbus, and the Caribbean is drawn to his private cosmography, Hispaniola meridian-wise as Cipango. This is the map's genuine claim to fame, and it cuts the other way too: where the sources err, the chart faithfully errs. |
| The southern coast is ice-free Antarctica on an Egyptian projection argued by Mallery 1956; Hapgood 1966; Ohlmeyer letter; Hancock 1995 | OPEN | The dispute this bench is built for. Against it: the coast joins South America with no Drake Passage, the notes on it describe heat and snakes, the fits cannot separate it from a bent Patagonia, on Hapgood's own projection Antarctica falls 11,400 km from the centre in a smeared arc, and the ice has been continuous for at least 800,000 years. The letter is real; what it compared was an eyeball match against a handful of sounding lines. |
| The map proves an ice-age civilisation of seafarers argued by Hapgood's thesis; the anchor of Fingerprints ch. 1 | READING | Unpaid on every computable count this bench runs, and resting entirely on the previous reading. A chart that loses 900 miles of Brazil, doubles the Amazon and ships phantom islands is a hard witness for polar-grade ancient geodesy; and any survey of a green Queen Maud Land predates the ice by tens of millions of years, not thousands. |
Try this
- Hover the projection. In the Projection view, sweep the cursor from Cairo outward and watch distance and bearing print live. Those two numbers are exact at any range. Everything else on the disc is paying for them, more with every ring.
- Find Antarctica on Hapgood's disc. Centre on Cairo, then look for the gold coastline near the rim. That smeared arc is what an Egyptian azimuthal equidistant projection actually does to Queen Maud Land, and it is nothing like the snug coast at the parchment's bottom edge.
- Watch the control finish. In the trial, note the ice-coast lane: no theory predicts it, and it fits about as well as the claim's candidate. That single comparison is most of the answer to 'agrees very remarkably'.
- Press jitter five times. Watch the RMS numbers move and the ranking occasionally swap. Any conclusion that changes when you re-trace a 500-year-old drawing was never about the coasts.
- Read the southern land's own note. Chart view, the ¶ at the bottom: a hot country, big snakes, animals drawn on the land. Whatever the cartographer thought he was drawing, he was not drawing an ice cap.
- Toggle the portolan skeleton. Projection view: the windrose geometry the chart actually wears, over the graticule the claim imposes on it. A compass frame needs no projection at all, which is the null hypothesis the whole centre argument must beat first.
Accuracy
The honest line between what is measured, what is modelled here, what the record claims, and what is a reading:
| Feature | Tier | What that means |
|---|---|---|
| The azimuthal equidistant mathematics | T1 Measured | Distance and azimuth from the chosen centre are exact by construction; everything else distorts, increasingly with distance. The bench computes the projection exactly, at any centre, and the hover readout prints the two true quantities live. This is the mathematics Hapgood invoked, granted its best case. |
| The modern coastlines and the Drake gap | T1 Measured | The world map, the Queen Maud ice coast and the Patagonian seaboard come from the public Natural Earth 110m dataset; the Drake Passage distance, roughly 800 km at its narrowest and computed on the bench as a great circle, is standard geography. The chart draws no strait at all. |
| The age of the ice | T1 Measured | The East Antarctic sheet dates to the Eocene-Oligocene transition, about 34 million years ago; the EPICA Dome C core is continuous through roughly 800,000 years. The claim needs Queen Maud Land surveyably bare within the last ten thousand. No party to the dispute has produced a mechanism that moves these numbers. |
| The redrawn chart | T2 Modelled | The Chart view is a stylised redrawing of the fragment's layout: coasts, windroses, notes and creatures sit where the originals sit, but every line is new, and the panel says so. It is a teaching drawing of a 500-year-old document, not a facsimile of one. |
| The digitised coasts and the fits | T2 Modelled | The map's southern coast is a hand trace, and the subglacial candidate is a schematic trace of published outlines; both are tagged MODELLED, and the jitter button re-traces the map coast within an honest tolerance to show how much the tracing matters. The similarity fit itself (48 arc-length samples, least-squares scale + rotation + translation) is exact arithmetic on those traces. |
| The claim, as published | T2 Reported | Mallery on the Georgetown radio forum, 1956; Hapgood, Maps of the Ancient Sea Kings, 1966, with the Egyptian projection centre from his class's grid analysis; the Ohlmeyer letter of 6 July 1960 as printed in Hapgood; Hancock's use of the chain in Fingerprints ch. 1. The strong words, "agrees very remarkably", "mapped before it was covered by the ice-cap", are quoted from the participants. |
| The objections, as published | T2 Reported | McIntosh, The Piri Reis Map of 1513 (2000), with Steven Dutch's critique: the marginal source list, the twice-drawn Amazon, the ~900 missing miles, the Columbus-shaped Caribbean, the Terra Australis convention, the absent strait, and the notes describing a hot country with big snakes on the southern land. Each is drawn or clickable where it lives on the chart. |
| What the southern coast is | T3 Reading | Ice-free Antarctica from lost sources, a chartmaker's Terra Australis, or South America bent east where the parchment ends: the fits alone cannot convict, and the bench prints why (all three candidates land within the same few hundred kilometres). The step from a wiggly coast to a lost civilisation is a reading, and it stays one. |
In one line: the projection and the fits are exact mathematics on public coastlines; the chart redrawing and both hand traces are disclosed models with a jitter audit wired in; the letter, the broadcast, the bibliography and both verdicts are quoted from their sources; the ice chronology is measured and unmoved; and whether the coast at the bottom of a 1513 parchment is Antarctica, convention, or Patagonia bent east is a reading the fits cannot settle and this instrument does not try to. Run the trial and decide for yourself.
Sources
- The Piri Reis map of 919 AH (1513). Topkapi Palace Library, Istanbul. The surviving gazelle-skin fragment, ~90 x 63 cm, with the marginal inscriptions this instrument quotes throughout.
- Kahle, P. Die verschollene Columbus-Karte von 1498 in einer türkischen Weltkarte von 1513. Berlin/Leipzig, 1933. The identification that made the fragment famous: its Columbus source.
- McIntosh, G. C. The Piri Reis Map of 1513. University of Georgia Press, 2000. The scholarly study: sources, inscriptions, the catalogue of errors, and the mundane readings of the southern coast.
- Hapgood, C. Maps of the Ancient Sea Kings: Evidence of Advanced Civilization in the Ice Age. Chilton, 1966. The claim in full: the grid analysis, the Egyptian centre, the ice-free reading, with the Ohlmeyer letter printed at the front.
- Ohlmeyer, H. Z., Lt Col, USAF. Letter to Charles Hapgood, 6 July 1960, Westover AFB. "Agrees very remarkably"; "mapped before it was covered by the ice-cap". As printed in Hapgood 1966.
- Mallery, A. Georgetown University radio forum, 1956. The first public Antarctica reading of the lower coast; the broadcast Hapgood heard.
- Hancock, G. Fingerprints of the Gods. Crown, 1995, ch. 1. The chain as carried to a mass audience. Reviewed on this site's culture shelf as Culture 14.
- Dutch, S. "The Piri Reis Map." University of Wisconsin-Green Bay web essay. The widely cited point-by-point critique: the bent coast, the missing miles, the scale problems.
- Norwegian-British-Swedish Antarctic Expedition, 1949-52. The seismic traverse of Queen Maud Land whose handful of sounding lines the Ohlmeyer comparison leaned on.
- EPICA community. "Eight glacial cycles from an Antarctic ice core." Nature 429 (2004). The ~800,000-year continuous Dome C record.
- Zachos, J. et al. "Trends, Rhythms, and Aberrations in Global Climate 65 Ma to Present." Science 292 (2001). The Eocene-Oligocene onset of the East Antarctic sheet, ~34 Myr.
- Natural Earth, 110m physical vectors (public domain). The coastlines behind the bench's world map, ice coast and Patagonian candidate.