The Law of the Times
The most famous clock in the UFO literature was published in January 1975: close-encounter reports rise from 5 p.m., peak about 9 p.m., dip at 1 a.m., bump at 3 a.m. Then the paper divided the clock by a second curve, the percentage of the working population not at home, and concluded that the phenomenon's true schedule peaks at 3 a.m. and that witnesses catch one close approach in fourteen: 2,000 reports, 28,000 manifestations. This bench rebuilds all of it. The evening law is real: fifty years later, 64,627 modern reports peak at the same clock hour, and the bench says so plainly. It is also explained: multiply the published awake table by the astronomy of darkness and the clock comes back at r = 0.88 with nothing fitted, while one toggle, darkness out, drops it to zero. The division is real too, and the bench reruns it exactly, reproducing the paper's plotted peak and its stated ×14, then hands you the dial the paper never drew: the divisor's night value, a hand-inked curve touching the axis, where half a percentage point of ink swings the famous multiplier from ×12.7 to ×18.7, one word (awake for not-at-home) drops it to ×5, and fully modern inputs leave ×3.6. The 3 a.m. bump the whole edifice feeds on appears in the 1975 catalogue and never again. The bench computes all of it and votes on none of it.
 Open the interactive ▸
 What you're looking at
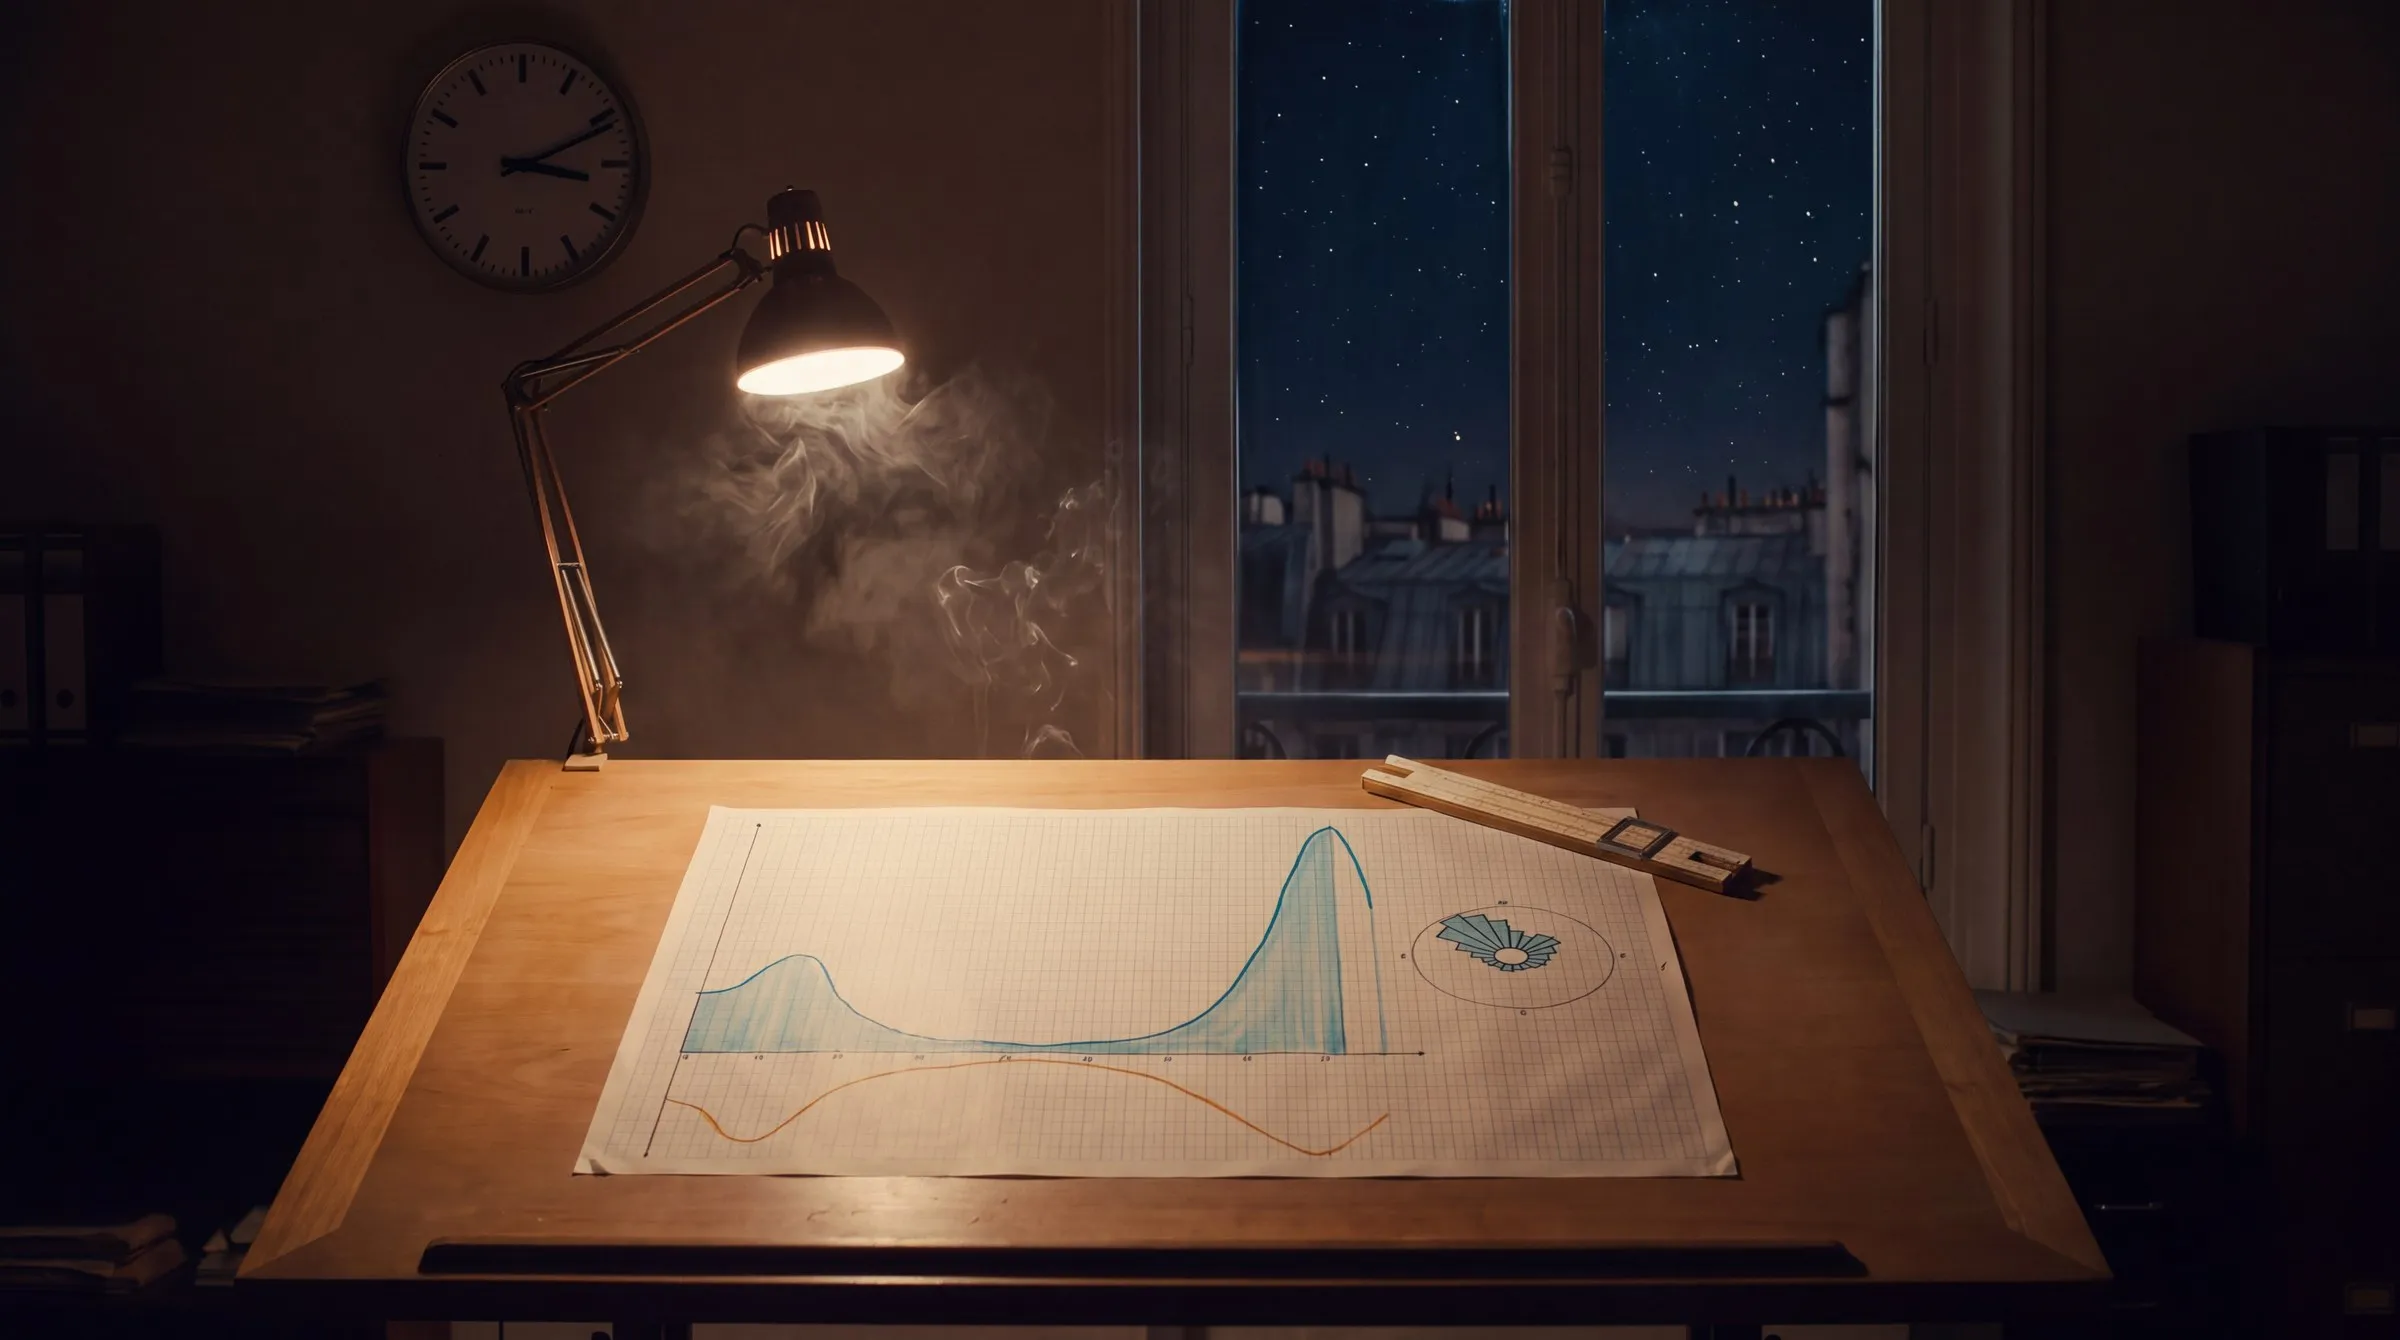
The Clock hangs the two report clocks on one axis: the 1975 type-I curve, digitized from the paper's hand-drawn Figure 8, and the modern NUFORC histogram, 64,627 US reports. A ghost overlay puts either on the other's scale; the landmarks of the law are flagged; a polar inset wraps the day around a clock face, where the report mass sits almost entirely on the dark side.
The Witness is the zero-parameter counter-model: the published awake fraction times the astronomy of darkness, scaled, nothing fitted. One toggle removes darkness and the correlation collapses from 0.88 to 0.00. A latitude dial moves the night; a daylight-visibility dial buys the daytime floor the strict model honestly lacks.
The Correction is the paper's manoeuvre run live: each hour divided by its witness fraction, for all four combinations of dataset and divisor, with Poisson whiskers on the counts and the night floor on a dial. At 2.0% it lands exactly on Figure 9's plotted peak; at 2.5%, on the stated ×14; the violet band shows what the same curve does across every plausible reading of the ink.
The File runs twelve cards: the law's verbatim wording and its borrowed name, the digitization's certificate, the uncited divisor, the ×14 quote, the night floor, the awake-versus-at-home word choice, the replication, the missing bump, July 4th, Hendry's IFO clock, the darkness variable, and what would count. Two verdicts hang below at equal size.
Why it's here
The station's review of The Invisible College records a detail: in January 1975, while writing that book, Vallée co-signed a technical statistics paper with Claude Poher of the French space agency. That paper houses the two most famous exhibits in the close-encounter literature: a report clock (peak about 9 p.m., dip at 1 a.m., bump at 3 a.m.), and the same clock after division by a "potential witnesses" curve: a 3 a.m. spire, and the sentence "witnesses are only in a position to observe one in fourteen close approaches". The book leans on it for the intuition that the phenomenon selects its audience; the literature later named the curve the law of the times. The law's data was never published as a table, only as a hand-drawn figure. This bench digitizes that figure pixel by pixel (the trace sums to 2,090 against the paper's stated 2,000, which is the digitization's certificate), reruns the famous division exactly, and then fits it with the two things it never had: error bars, and dials.
It is also the station's fifth statistics bench, after INST-37 Project Stargate (what a margin is worth against chance), INST-50 Special Report No. 14 (what a percentage is worth when the denominator moves), INST-60 The Nuclear Lure (what a correlation is worth against a base rate) and INST-68 The Wave Schedule (what a rhythm is worth against a null): this one asks what a division is worth against its own denominator. As ever, the answer is not presupposed. The evening law itself replicates verbatim in 64,627 modern reports, the same peak hour fifty years apart, and the bench draws it exactly; and the ×14 swings from ×5 to ×19 inside the divisor's last two percentage points, and the bench draws that too. Two verdicts hang at equal size in the file, and the dials are yours.
How it works
Everything on the bench is arithmetic on published records: the digitized 1975 figure, the federal time-use table, the public NUFORC file, and solar geometry. A script that ships with the site re-derives every displayed number before the build is allowed to pass, including the two numbers the 1975 paper itself printed: the Figure 9 peak and the ×14.
M(h) = awake(h) · [dark(h) + ε(1−dark(h))] · Nc(h) = N(h) / P(h) · envelope: P_night ∈ [1.6%, 3.0%] · whiskers: N ± 1.96√N
The 1975 record is a picture, so the bench treats digitization as evidence handling. The N and P curves were separated by connected components at 600 dpi, the axes auto-detected, the calibration checked against the printed ticks (N = 2.5 × the left axis, exactly). The trace sums to 2,090 against the stated ~2,000. Where the curve is legible, the bench trusts it; where it touches the axis, the bench refuses to read a single value and installs a dial instead.
The witness model earns the curve before questioning the correction. Awake × dark carries no fitted constants: two public tables and a product. It reproduces the modern clock at r = 0.88 and the 1975 curve at 0.83, and its one honest failure, a 20h peak against the data's 21h, is the solar-time/DST hour, printed rather than tuned away. Awake alone scores 0.00: the toggle that shows darkness, not wakefulness, carries the law.
The correction is reproduced before it is priced. The bench's division lands on the paper's own plotted peak at a night floor of 2.0% and on its stated ×14.3 at 2.5%: strong evidence for what the hand-drawn divisor's night value really was, and a validation that the arithmetic here is theirs. Only then does the bench sweep the floor, swap the divisor, and transplant it onto modern data, where the ×14 returns (×13.0) for the modern file too: proof the multiplier lives in the denominator.
The uncertainty that matters is not sampling. Poisson whiskers on the 3 a.m. cell span 4,835-6,965; the divisor envelope spans 3,933-7,375. The dominant error bar on the most famous number in close-encounter statistics is the width of a 1975 pen stroke near the axis, and no published critique we could find has ever said so: the bench says it with arithmetic instead of authority.
What survives every dial is worth stating: the evening law is real, stable and explained; the corrected peak lands in the small hours under every divisor, at ×3.6-×5.0 with checkable inputs; and the 3 a.m. bump, the ×14 and the 28,000 manifestations do not survive contact with error bars. Whether the surviving residue is a phenomenon that prefers empty hours or the arithmetic of dividing evenings by nights is the reading the bench leaves to you.
The dials that decide what happens
Two files, two divisors, a night floor, a latitude, a daylight term and one load-bearing toggle. Between them they manufacture and unmake the most famous multiplier in the literature, which is the exhibit.
- The file. The 1975 vetted catalogue (n ≈ 2,000, digitized) or the modern NUFORC scrape (64,627, recomputed). They agree on the evening; they part company at 3 a.m.
- The scale. Share-of-day makes the two files directly comparable; raw counts show what each actually holds.
- The darkness toggle. The single most consequential control on the bench: r = 0.88 with it, 0.00 without it. The 1975 paper never modelled the variable it flips.
- Latitude and daylight visibility. The darkness term's geometry, and the fraction of visibility a luminous stimulus keeps in daytime. The daylight dial buys the daytime floor; the peak is never for sale.
- The divisor. The published awake table, or the 1975 hand-drawn "not at home" curve. At 3 a.m. they differ by a factor of 2.5, and the famous ×14 inherits all of it.
- The night floor. The divisor's value where the pen touches the axis, swept 1.6-3.0%: the ×14 runs ×18.7 to ×12.7 across it, with the paper's own two anchors (the plotted peak, the stated ratio) at 2.0 and 2.5.
The claims, as they stand
Six claims that orbit the law of the times, from the 1975 paper's own sentences to the exposure counter-model, with where each lands against the arithmetic.
| Close-encounter reports follow a stable time-of-day law: rise from 5 p.m., peak about 9 p.m. proposed by Poher & Vallée, AIAA 75-42 (1975); first published 1963 | MEASURED | Measured and confirmed, plainly: the same 21h peak in the 1975 vetted catalogue (232 of ~2,000) and in 64,627 unvetted modern US reports (14.9% of the day), fifty years and two continents apart. The evening law is one of the most stable facts in the field's statistics. |
| The clock of sightings is the clock of witnesses proposed by the exposure reading; Hendry's IFO data (1979); Medina et al., Scientific Reports (2023), spatially | MEASURED | Measured here: awake × dark reproduces the clock at r = 0.88 with zero fitted constants, and one toggle (darkness out: r = 0.00) shows which half carries it. July 4th sextuples the file. Hendry's identified objects obey the same law (via Rogerson's review). The 2023 sky-view study finds the spatial version with an AARO director as co-author. |
| Corrected for potential witnesses, true activity peaks about 3 a.m. proposed by Poher & Vallée, Figure 9 | CONTESTED | Reproduced, with error bars added: every divisor tried does move the corrected peak into the small hours, because dividing any evening-peaked series by any night-bottomed curve must. The peak's position is robust; its size is not: the 3 a.m. cell is the division by the divisor's smallest, least legible value. |
| Witnesses see only one close approach in fourteen; 2,000 reports imply 28,000 manifestations proposed by Poher & Vallée, p. 8, verbatim | REFUTED | Refuted as stated: the multiplier lives in the divisor's last two percentage points. The night floor read at 1.6/2.0/2.5/3.0% yields ×18.7/×16.2/×14.3/×12.7; swapping the uncited "not at home" curve for the published awake table drops it to ×5.0; fully checkable modern inputs give ×3.6. The paper's own Figure 9 drew the night segment dashed; the text's ×14 carried no such flag. |
| The 3 a.m. secondary maximum is a stable feature of close-encounter reports proposed by the 1975 catalogues (118 of ~2,000 cases at 03h) | REFUTED | Not replicated in the only mass control available: the modern file declines monotonically from 21h to the 08h minimum, with no 1 a.m. dip and no 3 a.m. bump. The feature the whole correction feeds on is a property of the 1975 catalogue, not of the genre. |
| "Percent of the working population not at home" was the right exposure measure proposed by implicit in Figure 8; source uncited, likely Szalai 1972 | REFUTED | Contested by arithmetic: "not at home" zeroes every witness at a window, and at 3 a.m. reads ~2% where the published awake fraction reads 4.9%. That one word choice roughly doubles the famous multiplier, and it was never defended, or even cited, in print. |
Try this
- Start on the clock, modern file. The peak is 21h, 14.9% of the day. Toggle the ghost: the 1975 curve peaks at the same hour. Fifty years, same clock.
- Switch to the 1975 file and find 3 a.m. The bump: 118 cases against 232 at the peak. This cell is where everything downstream begins.
- Go to the witness. Turn darkness OFF. r = 0.00. Awake alone explains nothing. Turn it back on: r = 0.88, nothing fitted. That toggle is the whole argument.
- Go to the correction: 1975 file, "not at home", floor 2.0%. The corrected curve spikes to 5,900 at 3 a.m., exactly the peak the paper plotted. You have just rerun 1975.
- Drag the floor from 1.6 to 3.0. The multiplier runs ×18.7 to ×12.7 and the peak halves. Half a point of ink, half the conclusion.
- Switch the divisor to awake. ×5.0. One word, two thirds of the multiplier gone.
- Switch the file to NUFORC, divisor back to "not at home". ×13.0: the famous number returns on data that never produced it, because it lives in the denominator.
- End on the file. Read The Law, then The Night Floor, then the IFO Clock, then both verdicts: what was claimed, where it stands, and who keeps the same hours.
Accuracy
The honest line between what is reported, what is measured, what is modelled on them, and what is a reading:
| Feature | Status | What that means |
|---|---|---|
| The 1975 hourly curves | Reported | Figure 8 of AIAA 75-42, hand-drawn, digitized at 600 dpi for this bench: the type-I report curve N and the "percentage of the working population not at home" P. Validation: the N trace sums to 2,090 against the paper's stated ~2,000, the axis calibration reproduces the printed tick marks exactly, and all four textual landmarks of the law reproduce. Daytime P good to ±2pp; the night cells sit at the pen's width, which is why the night floor is a dial. |
| The modern clock | Reported | Hour-of-report histograms computed for this bench from the public NUFORC file (80,332 rows; 79,638 with a parseable local time; 64,627 US), recomputed twice independently. Self-submitted, unvetted, used as a mass control. The calendar census from the same file, with its 1st/15th date-rounding artifacts disclosed and excluded from the honest July 4th comparison. |
| The awake fraction | Measured | BLS American Time Use Survey, Table A-3, 2023 annual averages: percent of the population age 15+ sleeping at each hour, from tens of thousands of time-diary interviews. The published, machine-checkable replacement for the 1975 divisor: 4.9% awake at 3 a.m. against their ~2% out-of-home. |
| The darkness term | Modelled | The fraction of the year the sun sits below -6° at each clock hour, at a latitude on a dial: pure geometry, zero constants. Computed at local mean solar time; daylight saving shifts summer evenings by about an hour, a stated liberty visible as the model's 20h peak against the data's 21h. |
| The witness model | Modelled | Awake × dark, scaled to the file's total, nothing fitted: r = 0.88 against the modern clock, r = 0.83 against the 1975 curve. Remove darkness and r collapses to 0.00. An optional daylight-visibility dial (default 0) buys the daytime floor the strict model cannot produce: R² 0.34 → 0.63 at 10%. |
| The correction and its envelope | Modelled | The paper's own arithmetic, Nc(h) = N(h) ÷ P(h), run live for all four dataset × divisor combinations, with Poisson 95% whiskers on the counts and the night floor swept 1.6-3.0%: at 2.0% it reproduces Figure 9's plotted peak (5,900) exactly, at 2.5% the stated ×14.3. The envelope (×12.7-×18.7) is wider than the sampling error: the dominant uncertainty is the divisor's ink. |
| What the residue is | Reading | Every night-shaped divisor moves the corrected peak into the small hours (2-3 a.m., ×3.6-×5.0 with checkable inputs). Whether that modest residue is a phenomenon avoiding observation or the trivial consequence of dividing an evening-peaked series by a night-bottomed curve is a reading, and the bench declines to make it. |
In one line: the 1975 curves are REPORTED, digitized from a hand-drawn figure with the trace validated against the paper's own stated total and the night cells refused as constants; the modern clock and the calendar are REPORTED from the public NUFORC file, recomputed twice with the rounding artifacts disclosed; the awake table is MEASURED federal survey data; the darkness term, the witness model and the correction with its whiskers and envelope are MODELLED arithmetic with every choice on a visible dial, re-derived by scripts/law-of-times-tune.mjs before the build passes; and whether the corrected curve's small-hours residue is a phenomenon is a READING the bench declines to make, hanging the signal and the mirror at exactly equal size. Switch the file, choose the divisor, drag the floor, and watch what a division is worth.
Sources
- Claude Poher and Jacques Vallée, "Basic Patterns in UFO Observations", AIAA Paper 75-42, 13th Aerospace Sciences Meeting, Pasadena, January 1975 (DOI 10.2514/6.1975-42; the paper is freely mirrored, including at jacquesvallee.net). Figures 7, 8 and 9, the law's verbatim wording (p. 7) and the "about 14 to 1" passage (p. 8). The phrase "law of the times" appears nowhere in the paper; it is in print by 1979.
- Alexander Szalai (ed.), "The Use of Time: Daily Activities of Urban and Suburban Populations in Twelve Countries" (Mouton, 1972): the only time-budget study in the paper's bibliography and the likely source of the "not at home" curve; stated as inference, since Figure 8 carries no inline citation.
- U.S. Bureau of Labor Statistics, American Time Use Survey, Table A-3, "Percent of the population engaging in selected activities by time of day", 2023 annual averages (bls.gov/tus; archived copy on the Wayback Machine): the sleeping-by-hour table behind the awake divisor.
- NUFORC report scrape, geocoded and time-standardized (github.com/planetsig/ufo-reports; mirrored at Zenodo record 1205624): 80,332 rows; hourly histograms and the calendar census recomputed twice, independently, for this bench. Underlying reports are self-submitted to the National UFO Reporting Center.
- Allan Hendry, "The UFO Handbook" (Doubleday, 1979): 1,307 cases, 88.6% identified. Quoted through Peter Rogerson's review in Magonia No. 2 (Winter 1979/80), the source of "It will come as no surprise that IFOs obey the ‘Law of Times’"; the book's own IFO figure was not available to this bench and no page number is invented for it.
- R. M. Medina, S. C. Brewer and S. M. Kirkpatrick, "An environmental analysis of public UAP sightings and sky view potential", Scientific Reports 13, 22213 (2023): 98,724 NUFORC reports, light pollution credibly negative at -7.7% per SD; the spatial version of the exposure reading, with the then-director of AARO as co-author.
- Solar geometry: declination by the standard cosine formula, civil darkness at solar elevation below -6°; the darkness term is computed from these alone, at local mean solar time.
- Jacques Vallée, "The Invisible College" (1975; Anomalist 2014), reviewed in this site's culture wing: the book the statistics paper was written alongside, and the reason this bench exists.
Rerun the most famous division in ufology. Then read the ink it stands on.
Open the interactiveCompiled August 2026