The Nuclear Lure
It is the oldest pattern in the subject: the lights come to the missile fields, the labs, the weapons plants. In 2026 a documentary producer pushed the claim to its limit, saying insiders told him programmes laid controlled nuclear conditions as deliberate bait. The underlying correlation is real and on the public record. So is everything needed to price it. A fifth of 1960 America lived within fifty miles of something nuclear, under the most-watched, duty-to-report skies in the country. The year with 96 nuclear tests produced fewer reports than the year with ten; the two years with zero produced more; and across fourteen settings of the correlation dial, the only one that clears 5% has the sightings arriving before the tests. Run the expectation machine and chance alone manufactures 1,469 'near a nuclear site, during nuclear activity' stories out of Blue Book's own files. What survives all of this is not the pattern. It is a short stack of documented mornings, ten missiles dropping off alert among them, that no base rate can touch. This bench computes the first part and refuses to vote on the second.
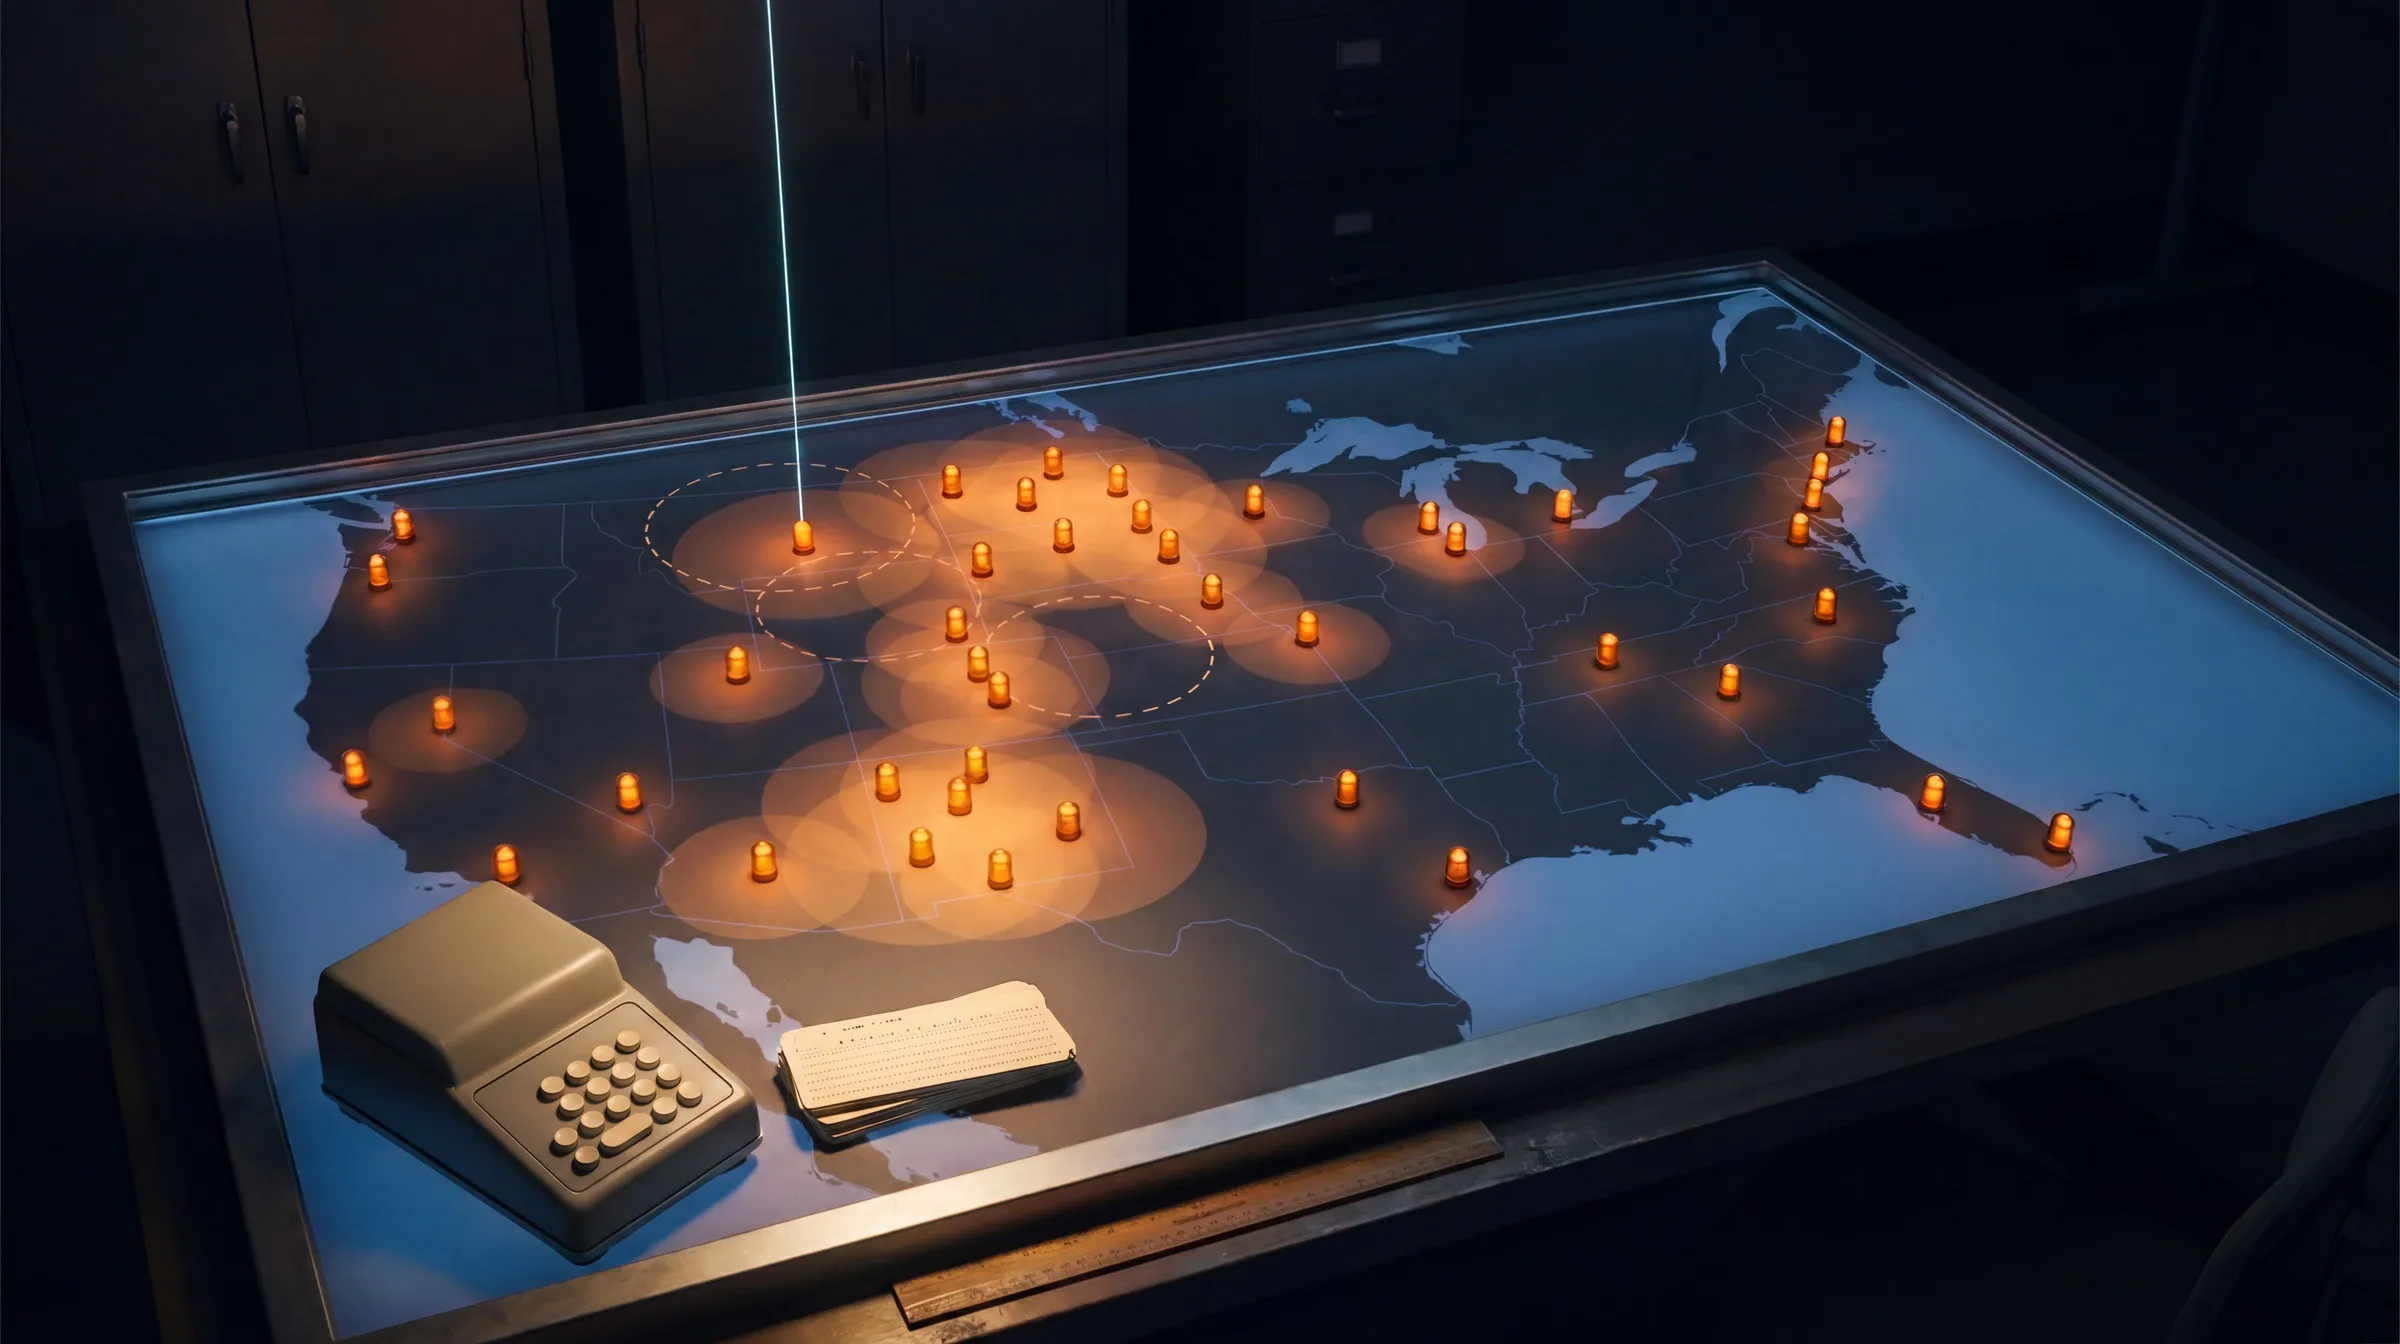 Open the interactive ▸
 What you're looking at
The Map lays the mid-1960s nuclear complex over the lower 48: nine missile fields drawn at their documented areas, the AEC production chain, the test sites, the first stockpile depots, the SAC bomber force, the naval nuclear yards. Six toggles, one radius dial. The machine computes, on a fixed grid weighted by area and by the 1960 census, what fraction of the country and its people were "near" something nuclear with no phenomenon involved: 21% of the land and 20% of the people at 50 miles, half of both at 100.
The Clock pairs the whole Blue Book file, 12,618 reports year by year, with every US nuclear test from the official DOE count. A lag dial and a statistic switch drive a live correlation gauge with a seeded permutation p value, and the strip below the gauge shows all fourteen dial settings at once, so the one nominal hit is seen in the company of the thirteen misses around it, and in its impossible direction.
The Mill is the expectation machine: reports × geographic base rate × test-date window, with Poisson error bars and a per-year strip. It answers the catalog question directly: how large a collection of 'UFO near a nuclear site during nuclear activity' stories does zero lure predict? At the default dials, about 1,469, which is more than enough to fill every book on the subject.
The File runs twelve cards from Hanford 1945 to the Farah claim of 2026, each labelled by what carries it: Boeing's noise-pulse investigation against Oscar Flight's missing paperwork, the NORAD logs of 1975, the Minot scope photos, Big Sur's contested film, the Pantex incident report of 2026. Two verdicts hang below at equal size, and the bench closes neither.
Why it's here
The culture wing of this station carries a note on Dan Farah's May 2026 interview and its two claims, the first of which is the "nuclear lure": that UAP are drawn to nuclear activity, reliably enough that programmes allegedly created controlled nuclear conditions to bait them in. That note (The lure and the quarterback) files the claim at tier 3, secondhand, and it also says one load-bearing sentence: the underlying correlation is real and on the public record. This instrument was built for that sentence. Between "real and on the public record" and "evidence of attraction" stand three pieces of arithmetic: how cheap it is to be near something nuclear, whether nuclear activity pulls the report curve, and how many "sighting near a nuclear site" stories chance alone manufactures from the file. All three can be run in a browser, in front of you.
It is also the station's third statistics bench, after INST-50, Special Report No. 14 (what a percentage is worth when nobody agrees on the denominator) and INST-37, Project Stargate (what a margin is worth against chance): this one asks what a correlation is worth against a base rate. The answer is not presupposed. The gauge shows whatever the clock computes; and the file hangs Echo Flight's morning exactly as it stands, stating which part carries Boeing's paperwork and which part is later testimony. Statistics dissolves patterns; it cannot touch a well-documented night. Pricing the two separately is the whole discipline of the bench.
How it works
Everything on the bench is arithmetic on published records: the Blue Book yearly table, the DOE test counts, the 1960 census, and a site catalog with its positions and areas stated. A script that ships with the site re-derives every displayed number before the build is allowed to pass.
coverage = Σ w(cell within R) / Σ w · p_perm = P(|r_shuffled| ≥ |r|) · E[both] = Σ_y n_y · p_geo · (1 − (1 − w)^{k_y})
The map is a weighted grid, not an impression. A 0.25° raster over the lower 48, 13,116 cells, each carrying its true area and its share of its state's 1960 population. A cell is near if it sits within the dial radius of any active layer, with missile fields counting from their edges because they are areas, not points. No randomness, no sampling error: move a dial and the same number comes back every time.
The correlation gauge prices its own multiple looks. Two statistics times seven lags is fourteen chances for noise to clear a threshold, and the bench draws all fourteen at once instead of showing the best one. The p value comes from shuffling the years 10,000 times with a fixed seed. At the natural setting the answer is r = 0.19, p = 0.39; the dial's single nominal hit, Spearman 0.51 at lag −1, has the reports arriving first.
The mill's model is stated and conservative. Reports are assumed to follow population, when the fences actually held the best-equipped observers in the country with a duty to report. The complex is held at its mid-60s extent, overstating the early-era base rate, which only lowers what a lure would need to beat. Test dates are treated as uniform within the year; real dates cluster, which shrinks the window union and again lowers the expectation. Every liberty taken runs against the bench's own conclusion.
The file separates what kind of thing each card is. A documented event with a testimonial cause (Echo Flight), testimony with no paper at all (Oscar Flight), paper with no identification (the 1975 logs), a contested memory of film nobody has (Big Sur), an institutional incident report (Pantex 2026). The statistics upstairs dissolve the pattern; they are silent on every one of these, and the cards say so.
What this bench will not do is convert a base rate into a debunking, or a documented morning into a visitation. The pattern claim and the case residue are different kinds of object, and the instrument's whole job is to stop them borrowing each other's strength: the catalog cannot cite Echo Flight to rescue the statistics, and the statistics cannot cite the base rate to erase Echo Flight.
The dials that decide what happens
Six layers, three dials, one switch. None of them can produce a lure, and that is the finding.
- The six layers. Missile fields, AEC complex, test sites, stockpile depots, SAC bases, naval nuclear. Toggle them singly to see who carries the coverage: the bomber force blankets the east, the missile fields own the northern plains, and the AEC chain fills the gaps.
- The radius. What "near" means, 10 to 200 miles. The whole pattern claim lives inside this word: at 10 miles near-nuclear is rare (4.5% of the land), at 50 it is one American in five, at 100 it is the default condition.
- The lag. Slides the test series against the report series, −3 to +3 years. Negative lags are acausal: tests moved to after the reports. The dial's only significant setting lives there.
- The statistic. Pearson for linear correlation, Spearman for rank order. The honest reason both exist: with series this short and this spiky, the choice matters, so the bench shows both instead of choosing quietly.
- The test window. ±0 to ±30 days around each test for the mill's double coincidences. At ±7 days the 96-test year is almost entirely 'during nuclear activity', which is exactly the problem with the phrase.
- Labels. Numbers on or off the charts, for reading against screenshots.
The claims, as they stand
Six claims that orbit the nuclear correlation, from the pattern itself to the strongest single case, with where each lands against the public record.
| UAP appear near nuclear facilities more than chance allows proposed by the pattern claim, from Hastings to Elizondo | CONTESTED | Untested as stated, because "chance" was never priced. This bench prices it: a fifth of the 1960 population lived within 50 miles of the complex, half within 100, and a civilian dataset with no nuclear question (Medina & Brewer 2023) already shows report density tracking military proximity. Excess above that base rate, which is what the claim needs, has not been demonstrated on any public dataset. |
| Nuclear activity pulls the report curve proposed by the dose-response version of the lure | MEASURED | Measured here, and null. Tests per year against reports per year, 1947-1969: r = 0.19 at permutation p = 0.39. The 77-test year sits on a falling curve, the 96-test year on a local minimum, and the zero-test moratorium on a rising one. The one dial setting that clears 5% has the reports leading the tests, which no lure can arrange. |
| Programmes created controlled nuclear conditions as deliberate bait proposed by Dan Farah, from unnamed sources, 2026 | READING | Unpriceable on the public record, and filed at tier 3 on this site. No programme, site or document is named. What this bench can price is the observable consequence a working lure should leave: excess over base rate in space and dose-response in time. The public record contains neither. |
| Echo Flight was shut down by a UFO proposed by Robert Salas and later testimony; the wing history disagrees | CONTESTED | The shutdown is documented; the cause attribution is not. Boeing traced a noise pulse through the logic couplers and could not name its source; the wing history records UFO rumours as checked and discounted; the object testimony surfaced later. The event is real, unexplained at the component level, and carries no contemporaneous object documentation. This bench's statistics have nothing to say about it either way, and say so. |
| The 1975 SAC overflights prove sustained interest in weapons storage proposed by the strong reading of the NORAD logs | CONTESTED | The intrusions are documented in the NORAD Command Director's log and base traffic; that paper is genuine and released. The objects in it are logged as helicopters, lights and unknowns, and no object was ever identified or recovered. Documented intrusion, yes; documented identity or intent, no. |
| Report geography is explained by observation opportunity proposed by Medina & Brewer, Scientific Reports 13 (2023) | MEASURED | Measured, peer-reviewed, on 98,000 civilian reports: density tracks sky visibility, air traffic and proximity to military installations, with no nuclear variable in the model. It is the working null for every geographic UAP pattern claim, this one included. |
Try this
- Start on the map at 10 miles. The amber wash is thin and the country is mostly dark. This is the map the pattern claim implies: nuclear sites as rare, special places.
- Drag to 50, then 100. A fifth of the population, then half. Watch the readout, not the wash: the question is never "is it near a nuclear site", it is "how hard is it not to be".
- Turn off everything but the missile fields and tap Malmstrom. One field, 23,500 square miles. Every famous "over the missile field" story has this denominator.
- Go to the clock and tap 1958. 77 tests under a falling report curve. Then tap the moratorium band: zero tests, rising curve. Then 1962: 96 tests, local minimum.
- Read the gauge. r = 0.19, p = 0.39. Then switch to Spearman and slide the lag to −1: the dial's only hit, in the direction where sightings come first. Tap the bar and read what fourteen looks buy.
- Go to the mill at the defaults. 2,539 near the complex, 1,469 also near a test. Tap the third bar: every unit of it is a publishable story that chance built.
- Slide the window to ±3 days and the radius to 25 miles. Still 341 double coincidences. The catalog does not shrink to zero under honest dials, and that is the point.
- End on the file. Read Echo Flight, then Oscar Flight, back to back: the same base, the same claim shape, and entirely different paper. That difference is the whole subject.
Accuracy
The honest line between what is measured, what is modelled on the measurements, and what is a reading:
| Feature | Tier | What that means |
|---|---|---|
| The Blue Book yearly table | T1 Measured | Reports per year, 1947-1969, with the unidentified count per year: 12,618 and 701, the programme's own closing totals, and both reconcile when the columns are summed, which is the first thing the verification script checks. The series carries the 1952 wave (1,501), the 1957 wave (1,006) and the 1965-67 wave intact. |
| The DOE/NV-209 test counts | T1 Measured | Every US nuclear test per calendar year, 1945-1969, from the official Department of Energy accounting: 1 in 1945 to 96 in 1962, zero in 1959 and 1960, and the underground-only era after August 1963. The clock view uses this series unmodified. |
| The 1960 census | T1 Measured | Resident population of the 48 conterminous states plus DC, 178,464,236 in total, spread uniformly over each state's grid cells (DC, smaller than one cell, lands as a point mass on its anchor cell). Population coverage numbers are weighted sums over these cells and the total reconciles to the census figure to within rounding. |
| The site catalog | T2 Reported | Six layers: nine ICBM fields at their documented areas (23,500 sq mi for Malmstrom down to 6,500 for Grand Forks, converted to equal-area discs), fourteen AEC complex sites, two test sites, the six original stockpile depots, thirty-six SAC bomber bases of the mid-60s force, eight naval nuclear yards and ports. Positions to the nearest installation. Two wings' field areas differ between sources by a few thousand square miles; the effect on the coverage share is under a point and the panel says so. |
| The coverage machine | T2 Modelled | A 0.25° grid over the lower 48 (13,116 cells), each cell weighted by its true area and by its state's census population. A cell is "near" if it lies within the dial radius of any active layer, fields counting from their edges. Area share and population share are weighted fractions; no randomness anywhere, so the numbers are exactly reproducible. |
| The correlation gauge | T2 Modelled | Pearson and Spearman r between tests per year and reports per year at lags from −3 to +3, with a two-sided permutation p from 10,000 seeded shuffles. All fourteen dial settings are drawn at once so the multiple looks are visible: r = 0.19 (p = 0.39) at the natural setting, and the single nominal hit on the dial is Spearman 0.51 (p = 0.017) at lag −1, where reports lead the tests. |
| The expectation mill | T2 Modelled | Each year's reports × the map's population share × the chance a random date falls within ±D days of at least one of that year's tests, computed as 1 − (1 − w)^k with w the window fraction of the year. At the default dials this yields 2,539 expected near-complex reports, 1,469 of them also near a test date, with Poisson error bars. Both model assumptions (reports follow population; test dates uniform in year) are stated on the card, and both bias the expectation downward. |
| The case file | T3 Reading | Twelve cards from Hanford 1945 to the Farah claim, each labelled by what carries it: documents, testimony, or both. The labels are this bench's reading of the public record and each card names its paper. What the residue cases actually were is left open, and the two verdicts hang at equal size. |
In one line: the Blue Book yearly table, the DOE/NV-209 test counts and the 1960 census are MEASURED and reconcile to their published totals; the site catalog is REPORTED, positions to the nearest installation and field areas as documented, with the two disputed areas flagged; the coverage shares, the permutation p values and the mill's expectations are MODELLED arithmetic on those inputs, with the models stated on the cards and every displayed number re-derived by scripts/nuclear-lure-tune.mjs before the build passes; and what the residue cases were is a READING the bench declines to make, hanging the cheap correlation and the undissolved mornings at exactly equal size. Toggle the layers, turn the dials, and watch what a claim is worth against its own denominator.
Sources
- Project Blue Book statistical summary: reports per year and unidentified per year, 1947-1969, as carried in the National Archives' Blue Book records and the Air Force fact sheet ("Unidentified Flying Objects and Air Force Project Blue Book"). Totals 12,618 and 701. The instrument uses the yearly table unmodified and reconciles both totals in the verification script.
- "United States Nuclear Tests, July 1945 through September 1992", DOE/NV-209, Department of Energy Nevada Operations Office. Tests per calendar year as tabulated (via the Arms Control Association's testing tally of the same document); US total 1,030 through 1992. The moratorium (November 1958 - September 1961) and the Limited Test Ban Treaty (August 1963) are drawn from the same record.
- U.S. Census Bureau, 1960 census of population: resident population by state. CONUS total 178,464,236 (179,323,175 less Alaska and Hawaii). State boundary geometry from the public-domain Census cartographic boundary file (the standard us-states GeoJSON), rasterised to a 0.25° grid by a generator script that ships with the site.
- Site catalog: ICBM wing field areas as carried in wing and Air Force histories (Malmstrom 23,500 sq mi; F.E. Warren 12,600 across three states; Ellsworth 13,500; Minot 8,500; Grand Forks 6,500 site-selection figure; Whiteman ~10,000, sources vary); Titan II complexes drawn as 30-mile fields around Davis-Monthan, McConnell and Little Rock. AEC production and laboratory sites, the original national stockpile sites (Manzano, Killeen, Clarksville, Medina, Lake Mead, Bossier), mid-1960s SAC bomber basing, and naval nuclear yards and ports, positions to the nearest installation.
- R. M. Medina and S. C. Brewer, "An environmental analysis of public UAP sightings and sky view potential", Scientific Reports 13, 22213 (2023): about 98,000 NUFORC reports, 2001-2020, against sky view, air traffic and military installation proximity.
- Echo Flight, 16 March 1967: Boeing, "Report of Engineering Investigation of Echo Flight Incident, Malmstrom AFB", and the 341st Strategic Missile Wing unit history for the period, which records the shutdown, the noise-pulse finding and the discounting of UFO rumours. Later testimony: Robert Salas (Oscar Flight) and associated accounts, collected in Salas & Klotz, "Faded Giant". The instrument's file view labels which part rests on which.
- October-November 1975 SAC weapons-storage intrusions: the NORAD Command Director's log and 24th NORAD Region Senior Director's log extracts released under FOIA, as collected in Fawcett & Greenwood, "Clear Intent" (1984), covering Loring, Wurtsmith, Malmstrom and Minot.
- Minot AFB, 24 October 1968: the Project Blue Book case file including the B-52 radar scope photographs. Big Sur, September 1964: Robert Jacobs and Florenz Mansmann's published testimony, against Kingston A. George, "The Big Sur 'UFO': An Identified Flying Object", Skeptical Inquirer 17 (1993).
- DOE-UAP-D001, "Enhanced PANTEX Imagery", U.S. Department of War PURSUE Release 02 (May 2026), covered in this site's Department of Energy files briefing. Robert Hastings, "UFOs and Nukes: Extraordinary Encounters at Nuclear Weapons Sites" (2008; 2nd ed. 2017), and the 27 September 2010 National Press Club conference.
- Dan Farah on the Danny Jones Podcast, 4 May 2026, as covered in this site's culture note "The lure and the quarterback": the nuclear-lure claim as stated, tier 3, secondhand. The note's own framing sentence, that the underlying correlation is real and on the public record, is the sentence this instrument prices.
Price the correlation. Then read the mornings it cannot touch.
Open the interactiveCompiled August 2026