Exoplanet Direct Imaging
We own exactly one photograph of an inhabited planet, and it was taken from inside the system: Earth at 0.12 pixel, caught in a sunbeam by Voyager 1 on Valentine's Day 1990. Taking the same picture from the next star over is a problem with two published numbers on it. An Earth twin at ten parsecs sits a tenth of an arcsecond from its star, and reflects one ten-billionth of its light. Both are pure arithmetic, and everything else follows from them: the Airy rings of a flawless mirror that bury the planet a million deep, the 2-picometer wavefront ripple that manufactures a perfect fake Earth, the deformable mirrors that dig a dark hole down to 1e-10, and the photon famine on the far side, one photon every eight seconds, that turns a single spectrum into days of integration. None of this is speculative: a vacuum testbed has already held 4e-10, ninety-eight planets have already been imaged, and the first active coronagraph in space launches this August. What is speculative is the last step, because in reflected starlight, the count of planets photographed to date is zero. This instrument builds the whole chain and hands you the dials.
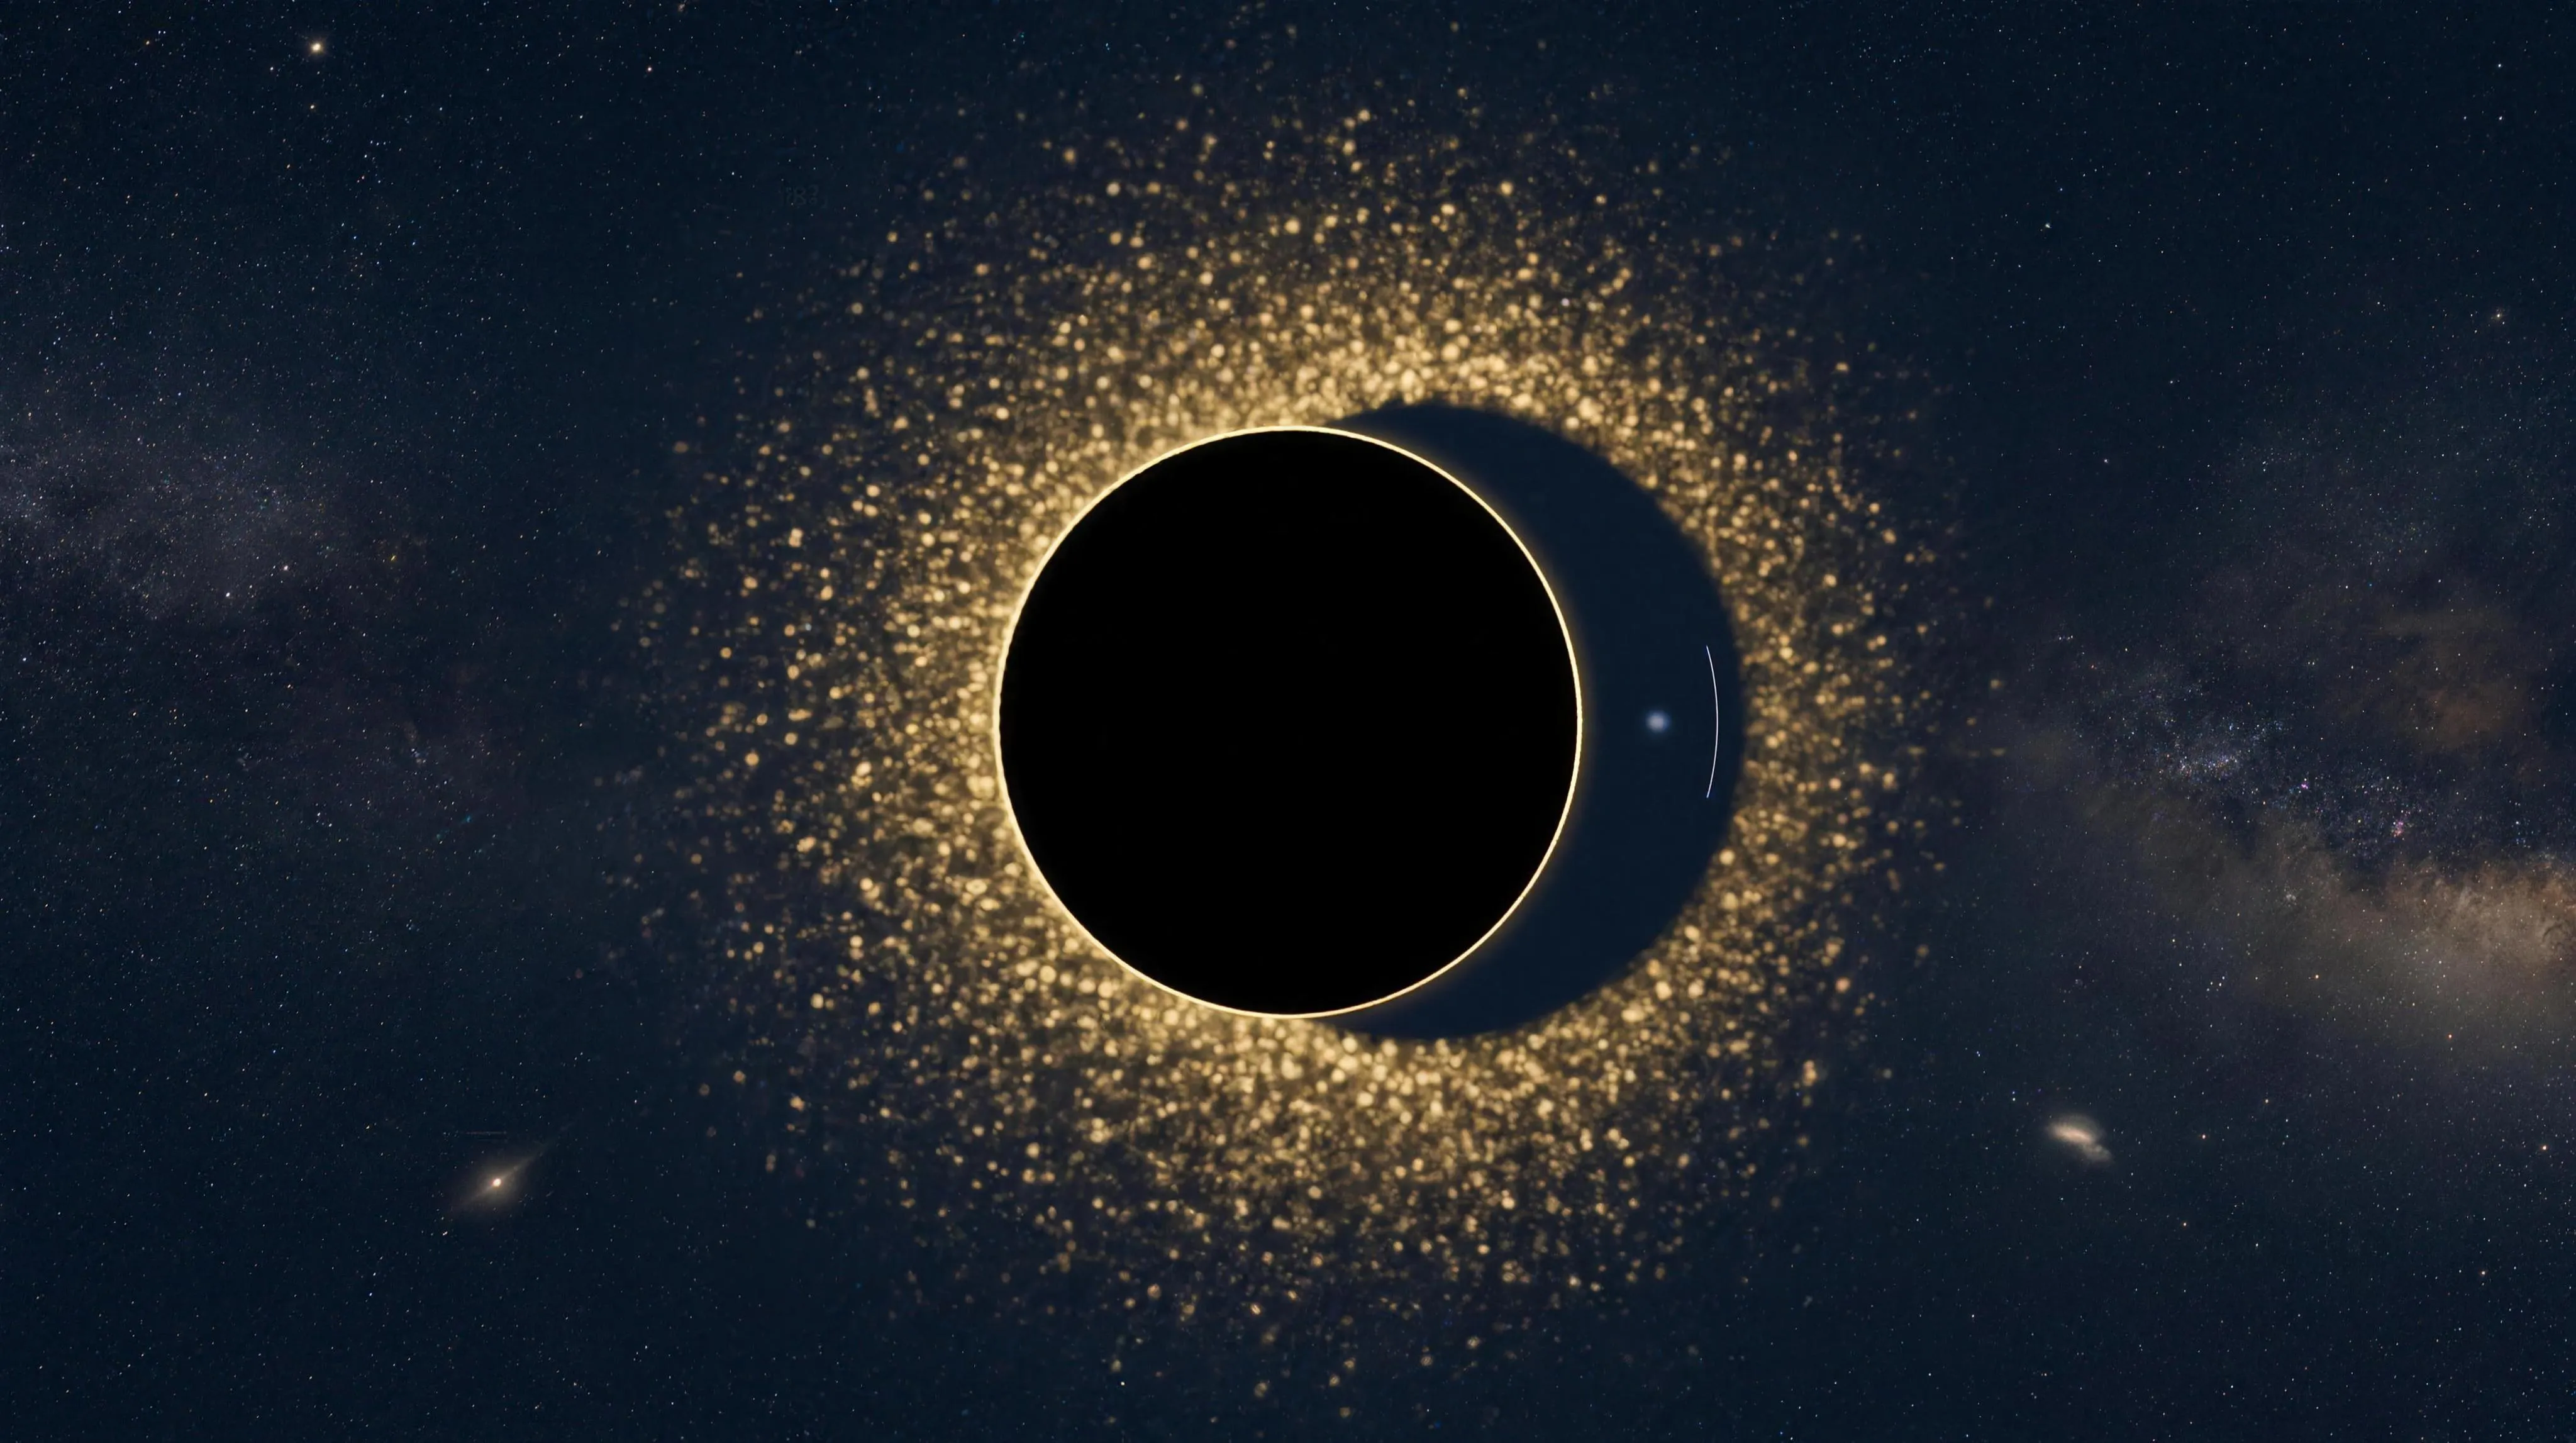 Open the interactive ▸
 What you're looking at
The System view is the geometry, in 3D, because the observability question is genuinely three-dimensional. A planet rides a tilted circle around its star, but the coronagraph lives on the sky plane: the dashed line drops the planet onto that plane, and the red circle on it is the inner working angle, the mask's ring of blindness. Drag to orbit, tip the inclination, and watch the projection point dive inside the ring exactly where the planet is at full phase and brightest. The inset in the corner is the honest summary: the sky plane face-on, one star, one ring, and one dot that sometimes becomes a red ✕.
The Coronagraph view is the bench. Stage one is a flawless bare telescope drawing its exact Airy pattern, nine logarithmic decades of glare. Stage two adds Lyot's 1930 mask and the rings collapse into a speckle field. Stage three adds the deformable mirrors and digs the dark hole, whose floor is set by one slider: wavefront stability, at (πh/λ)² per ripple. The planet appears as a dot when its contrast clears the local floor and a red ✕ when it does not, the photon counter prices what patience costs, and the profile strip below is the curve coronagraph teams actually publish.
The Ledger view is the field's entire history and future on one chart: contrast against separation, log-log. Everything ever imaged clusters top right, young self-luminous giants at 1e-4 to 1e-6. Everything worth breathing on sits bottom left, at 1e-9 and 1e-10. Between them run the floor curves of four real telescopes, the lab record at 4e-10, and the requirements. The ladder on the right is the neighbourhood: eleven real stars' habitable zones as angles, against the current mask.
The File view lays the half-century out: Voyager's 0.12 pixel in 1990, 2M1207 b in 2004, the double announcement of 13 November 2008 and Fomalhaut b's quiet dissolution into a dust cloud, the 98-planet harvest that never left the infrared, Roman's launch this August, and HWO's ~25 modelled Earths in the 2040s. Two verdict cards hang at equal size: the physics already in hand, and the photograph still owed.
Why it's here
INST-45, Technosignature Spectroscopy, closes on a confession: every Earth-like planet that transit spectroscopy can actually read orbits a small M dwarf, because only against a small star does a sliver of atmosphere print a legible signal. The genuine article, an Earth twin around a Sun twin, is simply out of that method's reach: a 0.47% chance the orbit crosses the star at all, one 84 ppm transit a year, 0.2 ppm per scale height of air. That instrument's file card hands the baton to the other route: don't wait for the planet to cross its star. Suppress the star's light by ten billion and photograph the planet outright. This instrument is that route.
It also earns its place as the station's purest case of proven physics standing beside an unpaid photograph. The whole speckle-and-dark-hole machinery has already touched 4e-10 on JPL's vacuum testbed, one step short of the mission number; meanwhile, as of mid-2026, the count of planets ever imaged in reflected starlight is zero, and all 98 imaged so far are young giants glowing in the infrared. One month from now Roman launches the first active coronagraph ever flown, to take the first reflected-light image in history; in the 2040s HWO is meant to survey ~25 exo-Earth candidates across a 164-star neighbourhood list. This instrument builds every rung between Lyot's 1930 occulting spot and that 1e-10 requirement, prints its assumptions on the bench, and leaves the reading, as always, to you.
How it works
One contrast formula, one diffraction pattern, one speckle law and one photon budget run the whole instrument, and the panel tags every number measured, reported, modelled or read.
C = A_g·Φ(α)·(R_p/a)² · I(x) = (2J₁(πx)/πx)² · C_speckle = K·(πh/λ)² · sep = a·√(cos²θ + sin²θ·cos²i)
The contrast is arithmetic and it is merciless. Reflected brightness is albedo times phase function times (radius over orbit)². For Earth beside the Sun that product is ~1e-10 at quadrature; Jupiter manages 1.4e-9; and no configuration escapes the phase trap, because Φ peaks at full phase, which is exactly where the projected separation collapses into the mask. Quadrature, at Φ = 1/π, is the standing compromise.
Diffraction is the enemy, and it is not a flaw. A perfect circular aperture spreads a point of starlight into the Airy pattern: 1.75% of peak in the first ring, ~1e-4 still at 10 λ/D. The bench draws it exactly, from the Bessel function. This is why you cannot simply block the star with a disc: the light bends around everything, and the fight is against physics, not engineering.
Speckles are starlight in planet costume. Any wavefront ripple of amplitude a scatters (πa/λ)² into a grain that sits where planets sit and looks how planets look: 2 pm makes an Earth. The floor model is one formula anchored to the published 10 pm ↔ 1.5e-10 correspondence, and each telescope's default stability is solved backwards from its published floor, landing on real hardware numbers: 24 nm on the ground, 11 nm for JWST, 85 pm for Roman, 8 pm for HWO. That agreement is the model's check.
The dark hole is where the mirrors win. Deformable mirrors can cancel speckles only inside the zone their actuators reach, N/2 λ/D for N across the pupil. Inside it the floor drops to what stability allows; outside, the glare stands. JPL's vacuum testbed has held ≤4e-10 across a 10% band since 2019. The physics is demonstrated; the segmented mirror that never sits still is the remaining bet.
And then the photons run out. Suppressing the star does not brighten the planet: an Earth twin at 10 pc is V ≈ 29.7 and delivers roughly one photon every eight seconds through a 6 m aperture after throughput. The R=140 spectrum that resolves the oxygen A-band is priced here at 14,000 planet photons, days to weeks per target, under two months for the faintest stars on the list. The dot is not seen. It is accumulated.
The published detections, the lab records, the star list and the speckle arithmetic are used exactly as the record gives them. The floor curves, the exozodi profile, the photon prices and the ~25-Earth yield are modelled, from assumptions printed on the face of the machine. The bench computes whether the dot is recoverable; it declines to compute what the dot would mean, because Sagan's own control experiment already showed how much argument lives between a detection and a verdict. Two cards hang at equal size, and the file stays open.
The dials that decide what happens
Four telescopes, four planets, a distance, an inclination, a coronagraph stage, and one slider that is the entire 2030s.
- The telescope: ground 8 m, JWST, Roman CGI, HWO. Four real machines spanning the four decades of contrast between what exists and what is required. Each carries its published aperture, wavelength, working angles and floor; switching them re-solves the whole bench, and the ledger shows whose game each planet is.
- The planet: Earth twin, Venus twin, Jupiter twin, young giant. The first three are reflected-light targets computed from albedo, phase and orbit. The fourth is the kind of planet humanity has actually photographed: self-luminous, phase-blind, a hundred thousand times easier, and the bridge between the ledger's two corners.
- Distance, 2 to 20 parsecs. The angular orbit shrinks as 1/d while the mask stays fixed, which is why the target list ends near 25 pc and why α Cen A, at 1.34 pc, is worth an entire candidate controversy on its own.
- Inclination, 0 to 90 degrees. Face-on orbits never hide; edge-on orbits dive through the mask twice a period and spend their brightest phases invisible. The median real orbit does some of both, which is why yields are statistics rather than promises.
- The coronagraph stage: bare, mask, mask + DMs. Three centuries of optics in three buttons: Airy's 1835 pattern, Lyot's 1930 mask, and the electric-field-conjugation dark hole that Roman flies this August.
- Wavefront stability, 1 pm to 30 nm. The slider that is the whole game. The floor follows h². At 24 nm you are a ground telescope; at 8 pm you are HWO and the Earth twin's dot rises out of the speckle field. Every contract NASA signed in January 2026 exists to move this slider three orders of magnitude.
The claims, as they stand
Six claims about photographing other worlds, with who established each and where it lands today. Two are settled, two are engineering and statistics still in play, one was published and did not survive, and one has been open since 1990.
| A coronagraph can suppress starlight to planet-hunting depths established by Lyot 1930; Trauger & Traub 2007; Seo et al. 2019 | SETTLED | Settled in the lab. Lyot photographed the Sun's corona without an eclipse in 1931; the same focal-plane-mask-plus-stop architecture, with deformable mirrors added, has held ≤4e-10 mean contrast in a 10% band in vacuum. The remaining question is not whether the optics work but whether they work on a segmented mirror in flight. |
| Direct imaging finds and characterises planets established by Chauvin et al. 2004; Marois et al. 2008; Balmer et al. 2025 | SETTLED | Settled, with a caveat about who. 98 planets imaged as of mid-2026, orbits watched in time-lapse, CO₂ measured in HR 8799 and 51 Eri b by JWST in 2025. Every one is a young self-luminous giant seen in the infrared: the method is proven exactly in the corner of parameter space where Earths are not. |
| Wavefront stability of ~10 pm is achievable in flight established by the HWO technology program, from Roman heritage | CONTESTED | The engineering question of the 2030s. Roman's 48×48-actuator control loop launches this August and is the first flight test of active dark-hole digging; HWO needs another two orders of magnitude of floor and picometer-class stability per control cycle on a segmented aperture. Ground testbeds are at single-digit picometers on sub-scale hardware. Nobody has demonstrated it end to end. |
| HWO will survey ~25 potentially habitable worlds established by Astro2020; Stark et al. yield formalism | CONTESTED | A model, honestly labelled. The 25 rides on η⊕ = 0.24 (SAG13), on exozodi near the LBTI median of 3 zodis, and on yield scaling as D^1.8. Bryson et al. 2021 put η⊕ anywhere from 0.37 to 0.60 with wide errors; halve or double η⊕ and the same telescope buys a different program. The number is a design target, not a promise. |
| Fomalhaut b was a directly imaged planet established by Kalas et al. 2008; retracted by Gáspár & Rieke 2020 | DID NOT SURVIVE | Did not survive. Imaged in visible light by Hubble, orbit fitted, twelve years on the books; then a decade of epochs showed it expanding and fading, a dust cloud from a planetesimal collision, with a second collision seen in the same system in 2025. Kept in the file as the cleanest lesson on what a false positive looks like at these contrasts. |
| A pale blue dot identifies a living world established by Sagan 1994, as poetry; Krissansen-Totton et al. 2016 and Arney et al. 2016, as spectra | READING | Open, and the closing argument of the file. Earth's U-shaped visible spectrum is distinctive but not unique: Rayleigh blue is mimicked by icy worlds, and Archean Earth, inhabited for a billion years, was orange under organic haze. Colour is triage, a spectrum is evidence, and neither is a verdict. The dot, when it comes, will start an argument, not end one. |
Try this
- Watch the projection dive. System view, inclination near 85°. The 3D planet is far from its star; its projection crosses the red ring twice an orbit anyway. That double blindness is pure geometry, and no telescope budget fixes it.
- Start the coronagraph at bare. The rings you see are a flawless telescope doing everything right. Note the colourbar: the first ring is 1.75% of peak, and an Earth is at 0.00000001% of it. Then add the mask and meet the speckles that replace the rings.
- Find the two-picometer Earth. Stage three, HWO, and drag the stability slider up from 8 pm. Somewhere around a hundred picometers the planet's dot drowns in grains that look exactly like it. Slide back down and it re-emerges. That h² law is the entire reason the word picometer appears in NASA contracts.
- Price a spectrum. Earth twin at 10 pc, HWO: read the photon chip. One photon every eight seconds; the R=140 spectrum costs days. Now move the planet to 5 pc and watch the price collapse: distance is quadratic in photons, and the target list is sorted by it.
- Read the ledger's two corners. Everything imaged, top right; everything wanted, bottom left; four decades of contrast between them. Then switch telescopes and watch each curve claim its own slice of the chart. Roman's curve stops halfway down, on purpose.
- Count the open habitable zones. Ledger, HWO: all eleven bars clear the mask. Switch to Roman: half close. The 164-star list is this arithmetic run for every nearby star, and it is F-dominated because brighter stars throw their habitable zones wider, the exact mirror image of the transit game's M-dwarf logic.
- Give the Earth twin exozodi. Three zodis of warm dust, the LBTI median, adds a haze right where the planet lives. Detection survives; spectroscopy gets more expensive. This is the noise term nobody outside the field has heard of and every yield model is built around.
- End at the file, on the two 2008 cards. HR 8799 became a time-lapse of real orbits and, by 2025, a CO₂ measurement. Fomalhaut b became a dust cloud. Both were announced the same day, in the same journal. Hold both before believing the next dot.
Accuracy
The honest line between what is measured, what the record reports, what is modelled here, and what is a reading:
| Feature | Tier | What that means |
|---|---|---|
| The two numbers | T1 Measured | An Earth twin at 10 pc sits 100 mas from its star, by the definition of the parsec, and reflects ~1e-10 of its light at quadrature, from Ag·Φ(α)·(R/a)² with published albedos. Jupiter's twin comes out at 1.4e-9. These are arithmetic on measured quantities, and the whole field is the fight against them. |
| The diffraction | T1 Measured | The detector view draws the exact Airy pattern of a circular aperture: first bright ring at 1.75% of peak, wings falling as 0.082/x³, still ~1e-4 at 10 λ/D. Textbook optics (Born & Wolf), drawn without simplification. A flawless mirror buries an Earth six orders of magnitude deep. |
| The speckle arithmetic | T1 Measured | A single wavefront ripple of amplitude a puts (πa/λ)² into a speckle: 2 pm at 500 nm gives 1.6e-10, an Earth impostor, which is where the ~10 pm stability requirement comes from. The bench's floor model is anchored to the published 10 pm ↔ 1.5e-10 correspondence. |
| The ledger and the lab | T1 Measured | Every detection plotted is a published separation: HR 8799 bcde, β Pic b, 51 Eri b, HIP 65426 b, with the α Cen A candidate drawn as an open circle because it was seen once and not recovered. The lab line is real: JPL's Decadal Survey Testbed held ≤4e-10 mean contrast in a 10% band in vacuum in 2019. |
| The neighbours | T1 Measured | The ladder is a slice of the ExEP Mission Star List (Mamajek & Stapelfeldt 2024): 164 stars inside 25 pc, 66 F, 55 G, 40 K, 3 M. Each bar is √L/d, the Earth-equivalent insolation distance as an angle. Which habitable zones open outside the mask is then geometry, not opinion. |
| The floor curves | T2 Modelled | One formula, C = K·(πh/λ)², carries every telescope's speckle floor, and each default stability is solved backwards from its published floor. That this lands on real hardware numbers, ~24 nm of ground AO residual, ~11 nm of passive JWST, ~85 pm Roman-class and ~8 pm HWO-class, is the model's check, not its input. The Lyot mask's 10³ diffraction suppression is illustrative; its resulting floor levels are not. |
| The photon budget | T2 Modelled | V-band zero point, 20% bandwidth, 0.3 end-to-end throughput: an Earth twin at 10 pc delivers roughly one photon every eight seconds to a 6 m aperture, and an R=140 spectrum is priced at 14,000 planet photons, landing on the published days-to-weeks per target. Change the distance and watch the price move. |
| What a pale dot means | T3 Reading | The bench computes whether the dot is recoverable. It does not compute what the dot means: Krissansen-Totton's U-shaped Earth spectrum is suggestive, not unique; icy worlds mimic the blue; Archean Earth was orange and inhabited. Two verdict cards hang at equal size, and the file stays open. |
In one line: the contrasts, the Airy pattern, the speckle arithmetic, the lab records, the published detections and the 164-star list are the record plus arithmetic, auditable on the bench; Fomalhaut b's rise and fall, the α Cen candidate and Roman's predicted-versus-required contrast are quoted and tagged REPORTED; every floor curve, photon price and the ~25-Earth yield are MODELLED from assumptions printed on the instrument, with each telescope's default stability solved from its published floor as the model's self-check; and what a pale dot would mean is a reading, for which this bench hangs two cards at equal size and adds no third. Dig the dot out, price the spectrum, and decide for yourself.
Sources
- Voyager 1, "Pale Blue Dot," 14 February 1990: Earth from ~6 billion km, 0.12 pixel inside a scattered-light sunbeam, part of the 60-frame Family Portrait sequence taken at Carl Sagan's urging as the cameras were retired. The quotation in the file is from Sagan's 1994 book of the same name.
- Chauvin, G. et al., "A giant planet candidate near a young brown dwarf," A&A 425, L29 (2004), and the 2005 confirmation by common proper motion: 2M1207 b, 5 ± 2 MJup at 778 mas (~55 AU projected) from a young brown dwarf in TW Hydrae, imaged with VLT/NACO. The first direct image of a planetary-mass companion.
- Marois, C. et al., "Direct Imaging of Multiple Planets Orbiting the Star HR 8799," Science 322, 1348 (13 Nov 2008), and Marois et al. 2010 for planet e. Masses 5-13 MJup at 0.39-1.72 arcsec from a ~30 Myr A star at 39.4 pc. Jason Wang's 12-year Keck time-lapse (2009-2021) shows the orbits directly; Balmer et al. 2025 (AJ) measured CO₂ in these planets and 51 Eri b with JWST NIRCam coronagraphy.
- Kalas, P. et al., "Optical Images of an Exosolar Planet 25 Light-Years from Earth," Science 322, 1345 (13 Nov 2008), and Gáspár, A. & Rieke, G., PNAS 117, 9712 (2020): a decade of HST epochs shows Fomalhaut b expanding and fading, consistent with a dust cloud from a collision of ~200 km planetesimals. A second collision in the same system was reported in Science in 2025.
- Macintosh, B. et al., "Discovery and spectroscopy of the young jovian planet 51 Eri b with the Gemini Planet Imager," Science 350, 64 (2015): ~2 MJup at ~13 AU with the strongest methane signature then seen on any imaged planet.
- Carter, A. L. et al. (2022): HIP 65426 b, JWST's first exoplanet image and the first beyond 5 µm. Matthews, E. et al., Nature 632 (2024): Eps Ind Ab at ~275 K (~2 °C), the coldest and nearest imaged giant at the time, 3.64 pc. Lagrange, A.-M. et al., Nature (2025): TWA 7 b, JWST's first outright imaging discovery and the lowest-mass planet imaged (~0.3 MJup).
- The "Worlds Next Door" JWST/MIRI series (2025, arXiv:2508.03814): a candidate point source 1.5 arcsec from α Cen A at 15.5 µm, contrast 5.5e-5, in the habitable zone, seen August 2024 and not recovered in February and April 2025. Carried on this bench as an open circle, which is what an honest ledger does with one epoch.
- NASA Exoplanet Archive counts page, July 2026: 6,333 confirmed exoplanets, 98 discovered by imaging. All imaged planets to date are self-luminous in the infrared; no exoplanet has yet been imaged in reflected starlight.
- Bernard Lyot: coronagraph invented 1930, first eclipse-free images of the solar corona 12 July 1931 at Pic du Midi. The focal-plane occulter plus Lyot-stop architecture flies unchanged in principle on Roman.
- Airy, G. B. (1835), as formalised in Born & Wolf, Principles of Optics: first bright ring at 1.75% of peak, ~84% of energy inside 1.22 λ/D, wing envelope ≈ 0.082/x³. Speckle arithmetic: a pupil ripple of amplitude a produces per-speckle contrast (πa/λ)², so 2 pm at 500 nm gives 1.6e-10; ~10 pm RMS corresponds to ~1.5e-10 near the diffraction limit (A&A 658, A84, 2022).
- Give'on, A. et al. 2007 for electric field conjugation; Seo, B.-J. et al. 2019 (Decadal Survey Testbed): ≤4e-10 mean raw contrast, 10% band, 360° dark hole at 3-9 λ/D in vacuum. Trauger, J. & Traub, W., Nature 446, 771 (2007): 6e-10 in a 2% band, the first sub-nanometric lab demonstration. The 2024 lab-performance survey for HWO is arXiv:2404.18036.
- Roman Space Telescope Coronagraph Instrument: 2.4 m aperture, hybrid Lyot coronagraph at 575 nm, dark hole 3-9 λ/D (~150-450 mas), two 48×48-actuator DMs, threshold requirement TTR5 = flux ratio 1e-7 at 6-9 λ/D, predicted performance 1e-8..1e-9. Launch 30 August 2026 on Falcon Heavy. A Class-D technology demonstration with ~90 days of observing time; candidate reflected-light targets include υ And d and ε Eri b.
- National Academies, "Pathways to Discovery in Astronomy and Astrophysics for the 2020s" (Astro2020): recommends a large (~6 m aperture) IR/O/UV space telescope to search for biosignatures from ~25 habitable zone planets, cost estimated at $11B, as the first mission of the Great Observatories Mission and Technology Maturation Program. NASA named the concept the Habitable Worlds Observatory in January 2023.
- HWO Exploratory Analytic Cases (arXiv:2601.11803): EAC-1 is a 6.0 m inscribed / 7.2 m outer off-axis segmented primary; coronagraph band 450-1700 nm; raw contrast ≤1e-10; wavefront stability of order 10 pm per control cycle; 96×96-actuator-class deformable mirrors. Project office stood up at GSFC August 2024; seven industry contracts January 2026; FY26 appropriation $150M against a $3.3M request; launch early 2040s.
- Mamajek, E. & Stapelfeldt, K., "NASA ExEP Mission Star List for the Habitable Worlds Observatory" (2024): 164 stars within 25 pc judged most accessible for a ~6 m coronagraphic survey; 66 F, 55 G, 40 K, 3 M. The ladder on this bench is a slice of that list with EEID = √L/d.
- Stark, C. et al., ApJ 795, 122 (2014) and the 2019 yield landscape: the exoEarth-candidate yield formalism, yield ∝ D^1.8, η⊕ = 0.24 (+0.46/−0.16) from the SAG13 meta-analysis; LUVOIR-A ~54 EECs, LUVOIR-B ~28, HabEx ~8 under the same assumptions. Bryson, S. et al., AJ 161, 36 (2021) later put η⊕ at 0.37-0.60 with wide uncertainties.
- Ertel, S. et al., AJ 159, 177 (2020), the completed LBTI HOSTS survey: median habitable-zone dust for Sun-like stars 3 zodis (1σ upper limit 9, 95% upper limit 27), "would not be a major limitation" for detection, with spectroscopy the harder case.
- Macdonald, E. & Cowan, N., PSJ 2, 184 (2021): Earth's transmission signal from afar is ~0.2 ppm per scale height, needing "dozens, if not hundreds" of transits; with one transit a year, true Earth analogues around FGK stars are out of transit spectroscopy's reach and belong to direct imaging. Geometric transit probability R☉/1 AU = 0.47%.
- Krissansen-Totton, J. et al., ApJ 817, 31 (2016), "Is the Pale Blue Dot unique?": Earth's U-shaped 350-1000 nm spectrum is distinctive but icy worlds mimic the Rayleigh blue. Arney, G. et al., Astrobiology 16, 873 (2016), "The Pale Orange Dot": hazy Archean Earth was habitable, inhabited and orange. Robinson, T. et al. 2010 and Cowan, N. et al. 2012 for ocean glint and its latitude-albedo false positive; Cowan et al. 2009 for the EPOXI rotational colour mapping.
- The EPRV Working Group Final Report (arXiv:2107.14291): an Earth analogue induces 9 cm/s on a Sun-like star; sub-10 cm/s radial velocity over years is the stated precursor requirement for masses and orbits of HWO targets. Imaging gives projected separation and position angle only; masses come from RV and astrometry.
Suppress the star. Recover the dot. Then decide what a pale blue pixel is allowed to mean.
Open the interactiveCompiled July 2026