Tabby's Star
In 2015 volunteers combing Kepler data found a star that dimmed by up to a fifth, with no period and no repeat, in shapes no planet can make. The explanations ran from comet swarms to a shattered planet to an alien megastructure. This instrument shows you the measured light, stages each reading, and lets you run the one test that has moved the argument: does the dip change colour.
 Open the interactive ▸
 What you're looking at
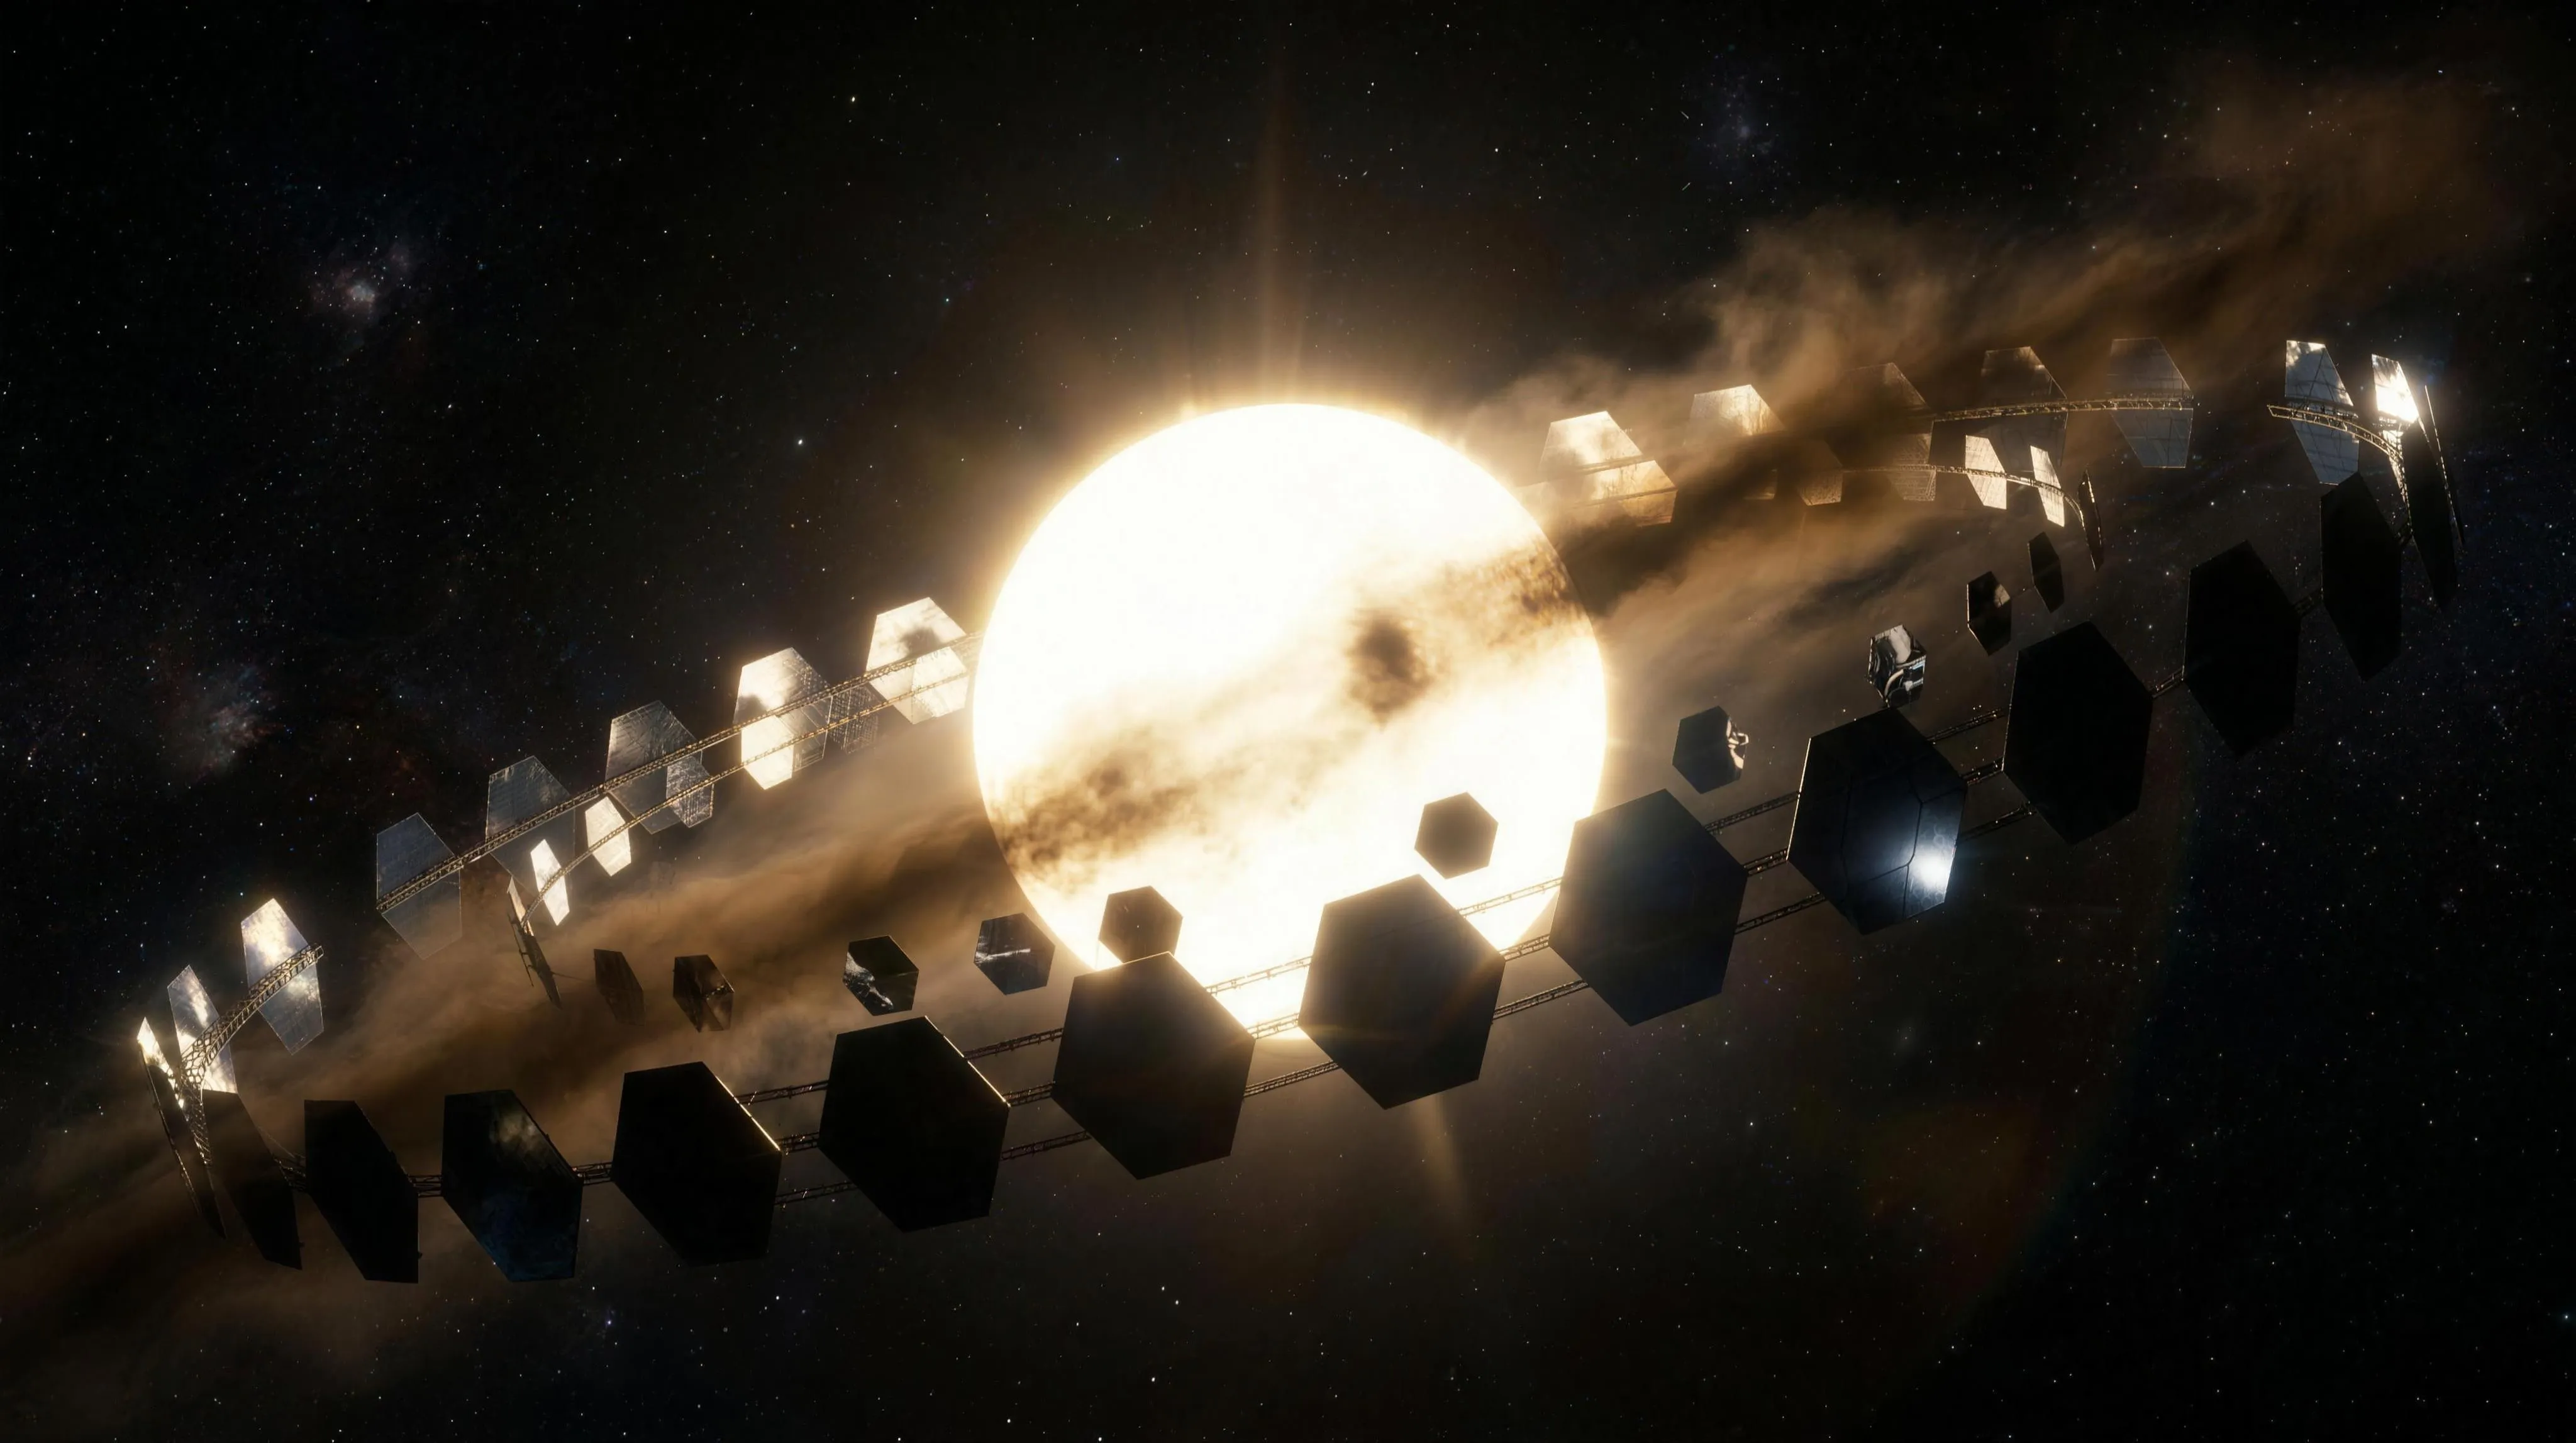
The Transit view is one thing crossing the star, drawn honestly. The F3V disk is rendered with the same quadratic limb darkening the light curve is computed from, so the centre is brighter than the edge. Pick what crosses it: a planet, an opaque disk that takes about 0.5%; a comet swarm, a ragged string of fragments and dusty tails; a dust cloud, translucent and extended; or a Dyson swarm, a field of hexagonal collectors whose dip is set by a coverage slider. The scrolling strip at the bottom is the live light curve, and it is real: it is computed by occulting the disk, sample by weighted sample.
The Blue / Red toggle is the point of the whole instrument. Fine dust scatters short wavelengths more than long, so a dust transit runs deeper in blue; a solid body, a planet or a panel, blocks every colour equally. Switch bands and watch the Blue minus Red cell: a gap means dust, a flat zero means a disk. This is the logic of the 2018 measurement that reshaped the debate, put in your hands.
The Curve view is the whole story at once: the full Kepler light curve over 1580 days, flat at the top and then falling into D792 at 16%, the deep D1519 complex at 22%, the D1540 triple-dip and D1568 at 8%. Toggle the Montet & Simon secular fade and the 2017 ground-based dips, and click any deep dip to read its depth, duration and shape. A legend along the top says, plainly, which reading each feature supports.
Why it's here
This instrument presses the site's whole method onto a single star. Tabby's Star has no witness recording and no leaked file, only a public light curve anyone can pull from MAST and a question still unsettled: what is blocking its light. That makes it a proving ground. When the evidence is just numbers, with no stake and no insider, how do you weigh "dust" against "comets" against "an engineered swarm". The answer is not a verdict but a test: switch the band, and let colour speak. Summarise, attribute, link; the verdict, as always, is yours.
It is also where three sibling instruments meet. When Avi Loeb proposed a lightsail reading of ’Oumuamua, he leaned on the very physics we cost seriously in The Laser Sail: a large, thin, reflective structure. A Dyson swarm is that same idea scaled to a star. And whether this star has anyone around it runs straight into the silence in the last four factors of The Drake Equation: SETI pointed its telescopes here, and the radio, the laser and the infrared all came back empty. After this instrument, you will know better what that silence weighs.
How it works
One idea runs the whole instrument: a transit is the fraction of a star’s light an occulter removes, weighted by how bright the disk is where it sits.
depth = 1 − ( ∫ I(μ) · T(x,y) dA ) / ( ∫ I(μ) dA ) · with · I(μ) = 1 − u₁(1−μ) − u₂(1−μ)² · u₁ = 0.32 · u₂ = 0.30
Limb darkening sets the shape. A star is a ball of gas, brightest where you look straight down into it (the centre) and dimmer toward the edge, where your line of sight grazes cooler, higher layers. The instrument uses the standard quadratic law for an F3V star, so an occulter crossing the centre takes more light than the same occulter crossing the edge. That is why even a planet’s tiny dip has a rounded, not flat, bottom.
Opaque bodies block; dust attenuates. A planet or a panel removes 100% of the light behind it: the depth is just the covering fraction, weighted by limb darkening, and it is the same in every colour. A dust cloud only dims what passes through it, by a factor exp(−τ), and its optical depth τ is larger in blue than red for sub-micron grains. That single difference is the colour test.
The light curve is computed, not drawn. The disk is sampled at 6400 points, each weighted by its limb-darkened brightness. Every frame, the moving occulters are projected onto the disk and each sample is marked blocked, attenuated or clear. Summing gives the instantaneous flux. Nothing about the dip is hand-animated; change the scenario or the band and the curve recomputes from the geometry.
The Curve view is the real record, modelled. The full Kepler light curve is rebuilt by superposing analytic dip profiles fit to the published depths and timings (Boyajian et al. 2016): symmetric for the shallow events, asymmetric for D792 (a slow ingress, a fast egress), a close triple for D1540. The secular fade follows Montet & Simon 2016. It is a faithful reconstruction of the data, tuned to match the paper.
The evidence is tagged as you go. The bottom-left table is the conscience of the sim. The Kepler curve, the depths, the 2018 colours and the empty SETI and infrared searches are MEASURED; this reconstruction and the dust and swarm models are MODELLED; which explanation you favour is a READING. Rows light up as you touch the matching control, so you always know which kind of claim you are looking at.
The photometry is measured; the colour result is measured; the empty searches are measured. The reconstruction and the optical models are modelled. Which of dust, comets, debris or a swarm is doing it is a reading, and the colour test points hard at dust. The staging, a star sitting still while one tidy object crosses it once, is the only liberty, and it is labelled where it happens.
The four things that cross the star
Four scenarios, from the mundane to the famous, each computed the same way so you can compare them fairly.
- Planet. An opaque disk the full width of Jupiter. The dip is symmetric, rounded by limb darkening, and about 0.5%, and even the widest planet known would reach only a couple of per cent. It is here to set the scale the deep dips break.
- Comet swarm. A clumpy string of fragments trailing dust. The dips are shallow, irregular and asymmetric, a few percent, and the tails add a faint colour. This is Bodman & Quillen’s 2016 model in miniature.
- Dust cloud. A translucent, extended cloud. The dip is deep and, crucially, deeper in blue than red. This is the leading explanation, and the one the band toggle was built to show.
- Dyson swarm. A field of opaque hexagonal collectors, with a coverage slider from nothing to half the disk. The dip depth just tracks the covering fraction, and it is achromatic, which is exactly why the 2018 colour result weighs against it.
The hypotheses
Every serious explanation on the record, with who put it forward and where it stands. Neutral, attributed, and no verdict: the reading is yours.
| Circumstellar dust proposed by Boyajian et al. 2018 | LEADING | Leading. Fits the colour test and the secular fade. Origin of the dust still open. |
| Exocomet swarm proposed by Bodman & Quillen 2016 | LIVE | Live. A family of fragmenting comets can make deep, irregular, aperiodic dips. |
| A consumed planet or melted moon proposed by Metzger et al. 2017 | LIVE | Live. Debris from a recent planetary disruption could feed the dust and the fade. |
| Intervening interstellar medium proposed by Wright & Sigurdsson 2016 | DISFAVOURED | Disfavoured. A cloud between us and the star struggles to fit the depths and colours. |
| Intrinsic stellar variability proposed by Wright & Sigurdsson 2016 | DISFAVOURED | Disfavoured. An F3 star has no known mechanism for dips this deep and abrupt. |
| A Dyson swarm proposed by Wright et al. 2016 (framing) | READING | A reading. Not formally excluded, but the achromatic prediction fails the colour test, and SETI plus WISE came back empty. |
Try this
- Run the colour test. Set the scenario to Dust, watch the blue dip, then switch to Red and watch it shrink. Now do the same on Planet or Dyson: nothing moves. The Blue minus Red cell is the whole 2018 result in one number.
- Find the ceiling. Switch to Planet and read the depth: about 0.5%. Then open the Curve view and look at D1519 at 22%. Forty times a planet. That gap is why the story ever needed comets, debris or a swarm.
- Build a swarm. On the Dyson scenario, drag coverage from 0 to 50% and watch the dip depth climb with it. Then switch bands: it stays flat. A swarm can make the depths, but it cannot make the colours.
- Read D792. In the Curve view, click the first deep dip. It is asymmetric: a slow week-long fade, then a fast recovery. No planet is that lopsided. That asymmetry is the first clue that something with structure crossed the star.
- Add the fade. Toggle the Montet & Simon secular fade in the Curve view. The whole baseline droops by a few percent across the mission. Dust explains both the dips and the fade; that is part of why it leads.
- End on the Evidence. Touch the band toggle and watch the colour row flash MEASURED; switch to the Dyson swarm and watch its row flash READING. The tags are the point: the same star, different kinds of claim.
Accuracy
The honest line between what has been measured, what is modelled here, and what is a reading:
| Feature | Status | What that means |
|---|---|---|
| The Kepler light curve: 1580 days, public on MAST | Measured | The dips are in the data. Anyone can download the photometry and see the same drops, up to about 22%, with no period and no repeat. This is the bedrock, and it is measured. |
| The dip depths and timings: D792 ~16%, the D1519 complex ~22% | Measured | Boyajian et al. 2016. These are the deepest dips ever measured on an ordinary main-sequence star, and their aperiodic, asymmetric shapes are the whole puzzle. The Curve view reproduces them. |
| The 2018 colour result: the dips are deeper in blue than in red | Measured | Boyajian et al. 2018, Deeg et al. 2018. Measured across multiple bands during fresh dips. This is the single most decisive fact, and the Transit view lets you reproduce its logic with the band toggle. |
| The empty searches: no radio, no laser pulses, no infrared excess | Measured | Harp et al. 2016 (radio), Schuetz et al. 2016 (optical SETI), Marengo et al. 2015 (no warm dust or waste-heat excess in WISE). Negative results, honestly measured, and each one weighs against an engineered swarm. |
| This reconstruction: analytic dips occulting a limb-darkened disk | Modelled | The Curve view superposes dip profiles fit to the published depths and timings; the Transit view computes flux by occulting a quadratically limb-darkened F3V disk (u1 0.32, u2 0.30). It is a faithful model of the data, not the raw Kepler pixels. |
| The dust optical model and the swarm geometry | Modelled | The colour effect is modelled from sub-micron grain scattering (blue optical depth above red); the Dyson scenario is a covering-fraction model. Both are physically motivated illustrations of the leading readings, not fits to a specific published cloud. |
| Which explanation is doing it: dust, comets, a shattered planet, or a swarm | Reading | Circumstellar dust leads on the colour test and the secular fade (Boyajian+ 2018, Montet & Simon 2016); exocomets (Bodman & Quillen 2016) and consumed-planet debris (Metzger+ 2017) remain live; the Dyson swarm (Wright+ 2016 framing) is disfavoured by every test but not formally excluded. The choice is a reading. |
| Schaefer's century-long dimming from old photographic plates | Contested | Schaefer 2016 reported a ~14% fade since 1890; Hippke et al. 2016 and others argued it is an artefact of the heterogeneous plate archive. Presented here as contested, because that is what it is. |
In one line: the Kepler light curve, the dip depths and timings, the 2018 result that the dips are deeper in blue, and the empty radio, laser and infrared searches are all measured; this reconstruction and the dust and swarm models are modelled from those measurements; and which of dust, comets, debris or a swarm is doing it is a reading, on which the colour test points hard at fine dust and nothing formally excludes a swarm. The instrument takes no side.
Sources
- Boyajian, T. S., et al. (2016). Planet Hunters IX. KIC 8462852, where’s the flux? MNRAS 457, 3988. arXiv:1509.03622. The discovery paper: the dips, the depths, the absence of a period.
- Wright, J. T., et al. (2016). The Ĝ Search for Extraterrestrial Civilizations with Large Energy Supplies. IV. ApJ 816, 17. arXiv:1510.04606. The framing that put a Dyson swarm on the table, and how to test it.
- Marengo, M., Hulsebus, A., & Willis, S. (2015). KIC 8462852: The Infrared Flux. ApJL 814, L15. No warm-dust or waste-heat excess in WISE.
- Harp, G. R., et al. (2016). Radio SETI Observations of the Anomalous Star KIC 8462852. ApJ 825, 155. arXiv:1511.01606. The Allen Telescope Array listened; nothing.
- Schuetz, M., et al. (2016). Optical SETI Observations of the Anomalous Star KIC 8462852. ApJL 825, L5. arXiv:1602.00987. A search for laser pulses; nothing.
- Montet, B. T., & Simon, J. D. (2016). KIC 8462852 Faded Throughout the Kepler Mission. ApJL 830, L39. arXiv:1608.01316. The secular fade across the four years of data.
- Schaefer, B. E. (2016). KIC 8462852 Faded at an Average Rate of 0.165 Magnitudes per Century from 1890 to 1989. ApJL 822, L34. arXiv:1601.03256. The contested century-long dimming.
- Hippke, M., et al. (2016). Reproduction of the KIC 8462852 Century-Long Dimming with the DASCH Data. arXiv:1601.07314. The rebuttal: an artefact of the plate archive.
- Bodman, E. H. L., & Quillen, A. (2016). KIC 8462852: Transit of a Large Comet Family. ApJL 819, L34. The exocomet-swarm model.
- Metzger, B. D., Shen, K. J., & Stone, N. (2017). Secular dimming of KIC 8462852 following its consumption of a planet. MNRAS 468, 4399. arXiv:1612.07332. The consumed-planet reading.
- Boyajian, T. S., et al. (2018). The First Post-Kepler Brightness Dips of KIC 8462852. ApJL 853, L8. arXiv:1801.00732. The colour test: the 2017 dips are deeper in blue. Fine dust, not a solid object.
- Deeg, H. J., et al. (2018). Non-grey dimming events of KIC 8462852 from GTC spectrophotometry. A&A 610, L12. Independent confirmation of the chromatic dips.
- Dyson, F. J. (1960). Search for Artificial Stellar Sources of Infrared Radiation. Science 131, 1667. The original: a swarm of collectors, and the waste heat to look for.