Fata Morgana
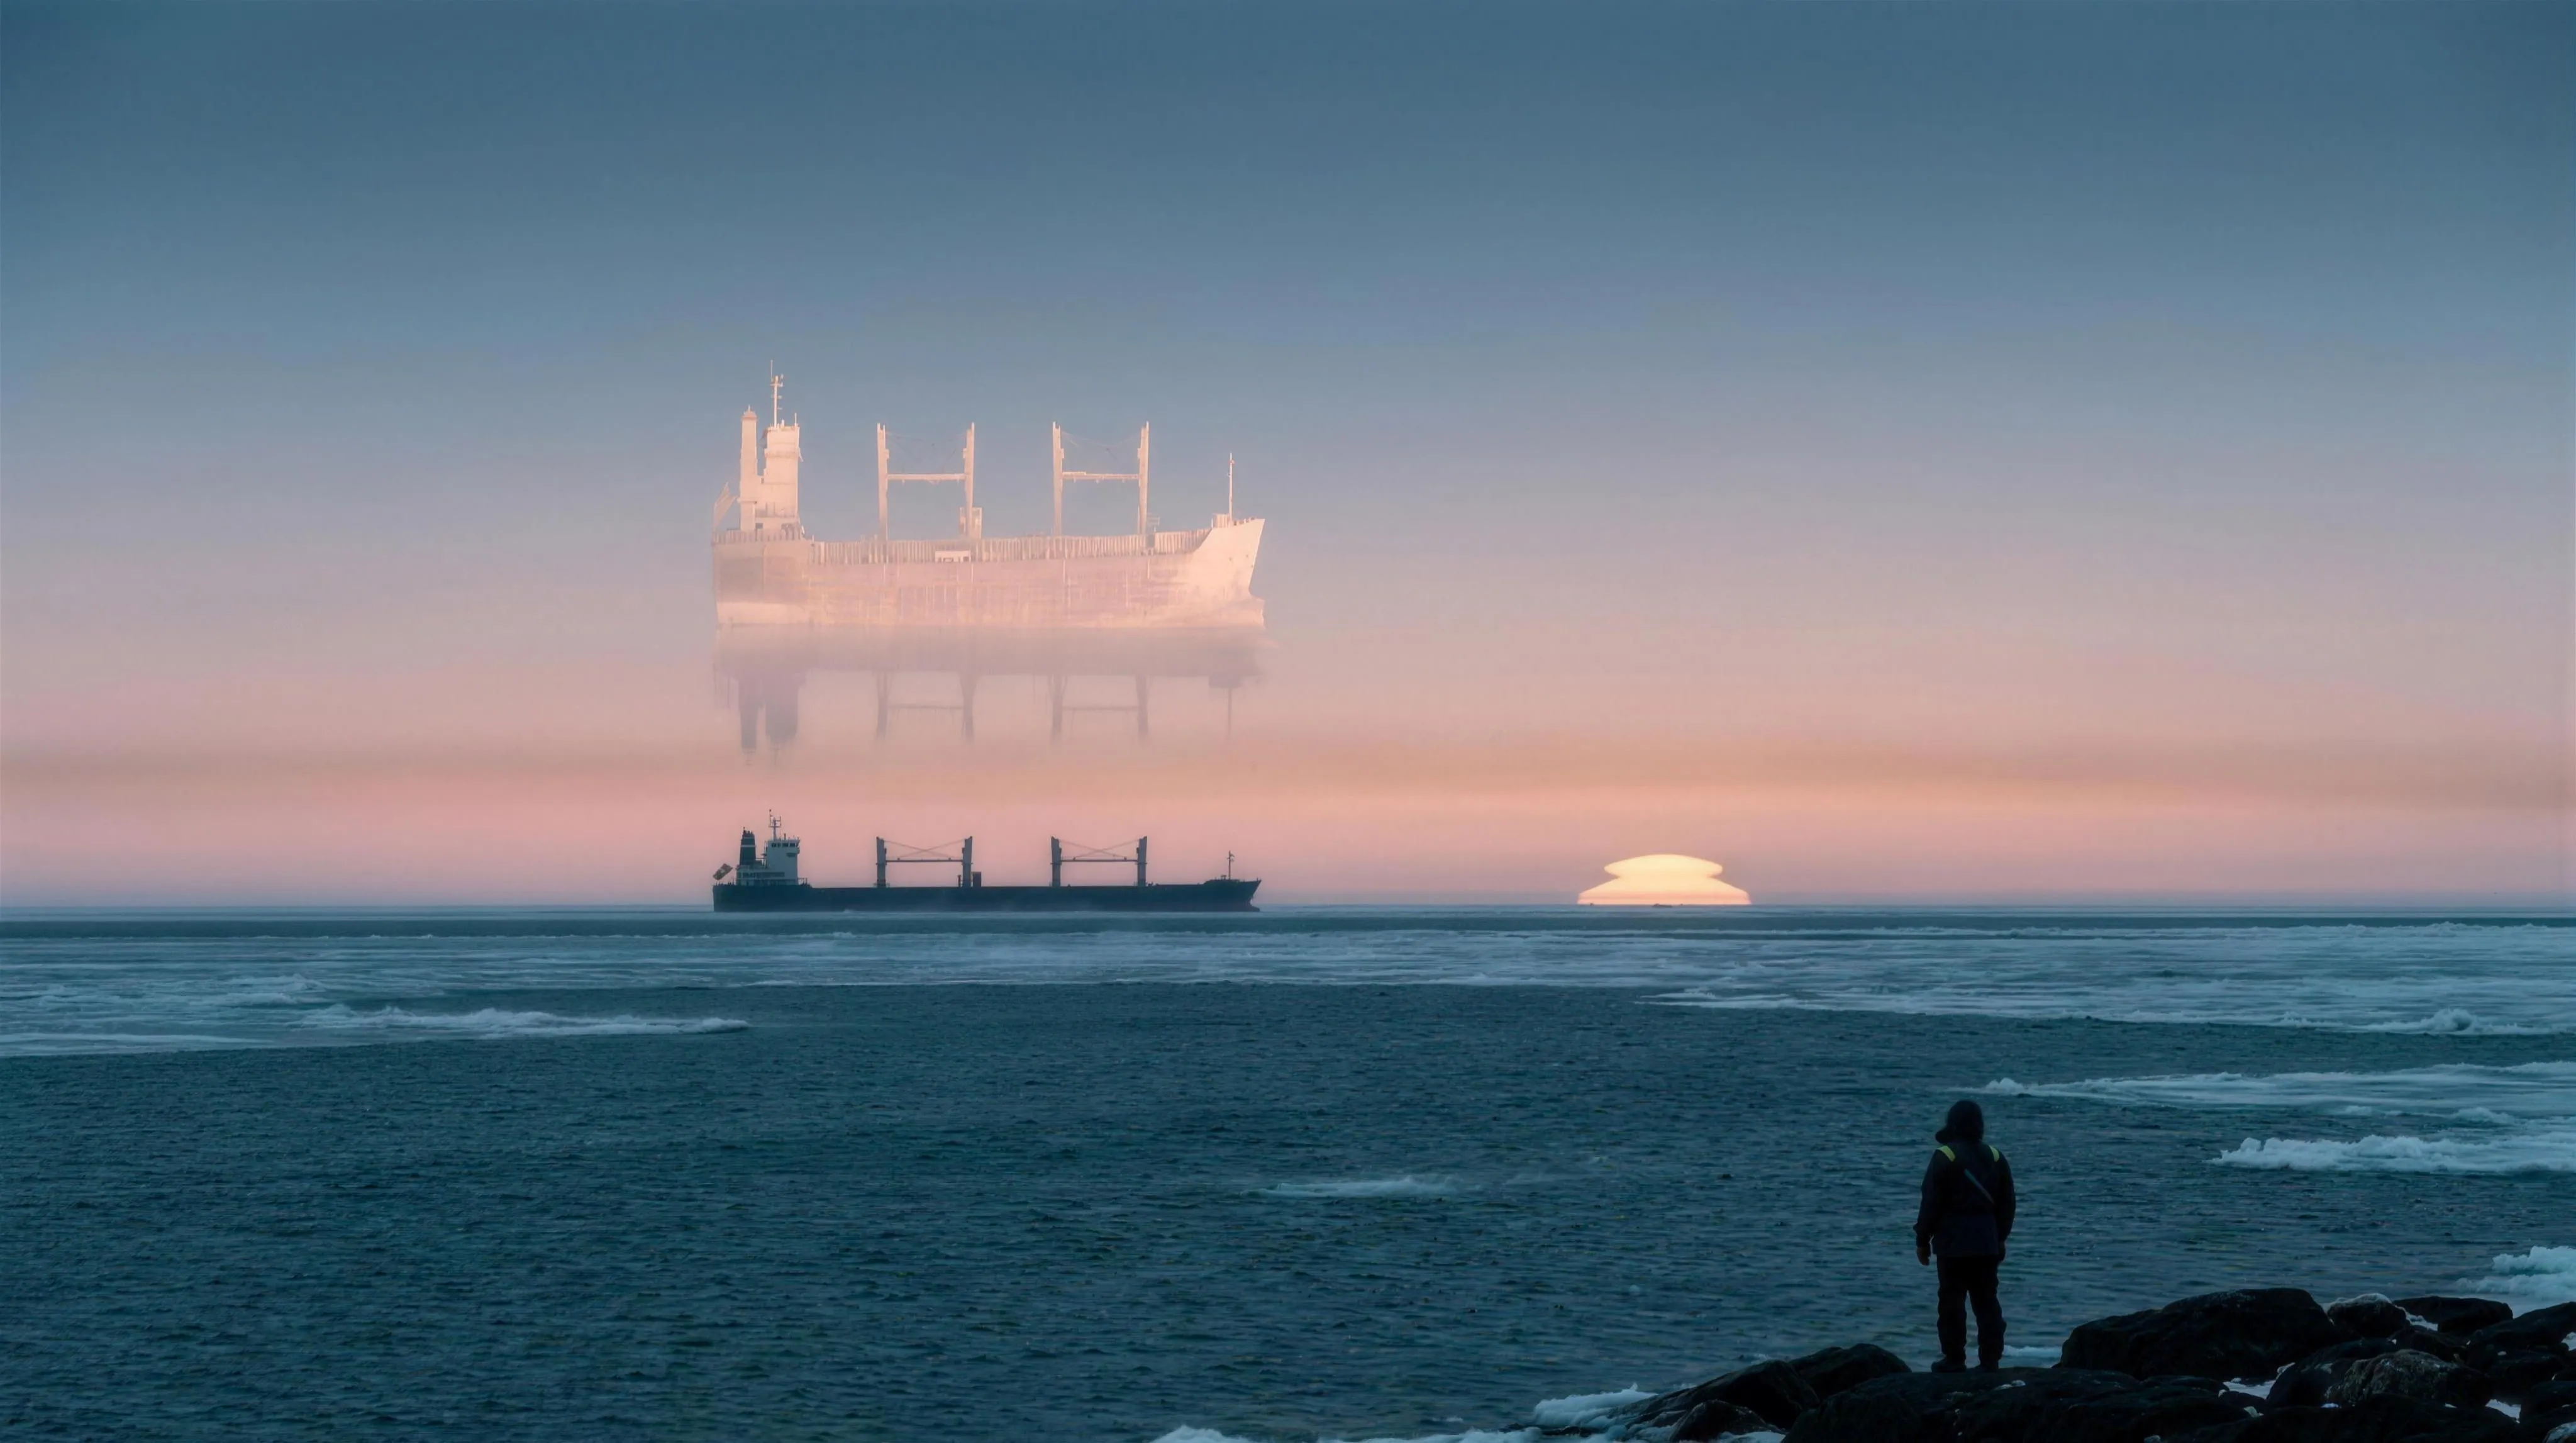
On calm mornings over the Strait of Messina the horizon grows walls, arches and towers, and sailors blamed the sorceress Morgana for building castles in the air. The trick is a temperature inversion: warm air over cold water bends light down faster than the Earth curves away, and the low sky becomes a light guide that serves the same ship back three times, stretched, stacked and upside down. The same duct raised the polar sun two weeks early for Barentsz's icebound crew in 1597, floats car headlights over Queensland as the Min Min light, and lensed US-67 traffic into the Marfa lights until physics students caught it with traffic counters. This instrument traces the light itself: every row of the picture is a computed ray through an atmosphere you dial. Build the wall, count the images, then read the survey that bounded what mirages can and cannot explain. The formulas are textbook, the cases are sourced, and the reading is yours.
 Open the interactive ▸
 What you're looking at
The Strait view is a picture with no hand-drawn pixels: one ray is traced per screen row through the temperature profile you dial, and whatever each ray lands on, sea, silhouette or sky, is painted back. Standard air keeps the ship hull-down behind the Earth’s bulge. Crank the inversion and the hull climbs back over the horizon, doubles, inverts, and smears into the stacked band that is the Fata Morgana proper. A true-scene inset keeps the honest geometry on screen, and the shimmer toggle lets the layer breathe.
The Ray Bench is the mechanism laid flat: T(z) and M(z) profiles on the left, the ray fan over the sea on the right. Where the inversion makes dM/dz negative the band shades rose and rays bend back down: a duct, the same object INST-30 builds for radar over Washington. The chip below prices admission live: the exact inversion, in kelvin per hundred metres, at which light curves as fast as the Earth falls away.
The Image Machine is the whole phenomenon as one curve: true height at the target across, apparent elevation up. No atmosphere would be a dashed straight line. The duct folds the curve back on itself, and every fold is another image: erect where the curve runs forward, inverted where it runs back, towering where it steepens. Drag the probe to any height and count its images; the status bar’s IMAGES number is this count.
The File view lays the record out on a broken 1597-2004 timeline: de Veer’s early sun and its 2003 ray-traced solution, the Messina name, the Silent City hoax, Viezee’s Condon Report survey, and the two instrumented reproductions, Min Min and Marfa. Below hang the two verdict cards at equal size: what the duct delivers, and where the explanation stops. Click any card to read it in full.
Why it's here
This station's files hold a great many nocturnal lights: floating, splitting, wobbling along the horizon. Behind every one of them stands the same unspoken question: how much of this can the atmosphere do by itself? INST-30, Washington 1952, answered it once already in the radio band: an inversion folding ground targets back onto the scopes. This instrument is the same machine in the optical band, and it is literally the same formula: refractivity riding on temperature and pressure, the ray equation y'' = 10⁻⁶ dM/dz unchanged, the only difference being that the optical band carries no water-vapour term. Side by side, the two instruments are the complete two-volume set on the atmosphere lying to sensors.
There is a harder reason to pick it: of all the misidentification sources, the mirage is the one most beautifully nailed down by field experiment. The sun that came back two weeks early over Novaya Zemlya in 1597 was reproduced date by date with ray-tracing in 2003; the same year Pettigrew parked a car with its headlights on behind a rise in Queensland and six witnesses watched the Min Min light float over the horizon; in 2004 a team of physics students matched the Marfa lights to US-67 traffic with counters and conjured one on cue with a headlight flash. And the Condon Report chapter that handed UFO investigators this physics also wrote down its bounds in plain sight: within about one degree of the horizon, range priced at D = 500 H. So this bench sets out both ends: the wonders compute live, and so do the limits. The verdict, case by case, belongs to the reader.
How it works
One equation runs every view, and the panel tags each number as measured, reported, modelled or read.
N = 79 P/T · M(z) = N(z) + 0.157 z · ray: y’’ = 10⁻⁶ dM/dz · duct: dM/dz < 0 · threshold ≈ +0.11 K/m · bounds: ~1° of horizon · D = 500 H
The tracer is the renderer. The scene view assigns each screen row an apparent elevation, integrates that ray out to the target in 30 m steps, and paints back what it hits. Stacked images, inverted bands, towering, the false water of the desert road: none of it is drawn. It all falls out of one second-order ODE and a temperature profile.
The duct is a sign flip. M(z) adds the Earth’s curvature to the refractivity, so a ray behaves like a marble rolling on the M curve. Standard air: dM/dz > 0 everywhere, the marble runs away, rays escape. Inversion strong enough: dM/dz < 0 in a band, the marble rolls back, light is trapped and guided around the bulge. The threshold is computed from your dials, not quoted.
The transfer curve is the honest summary. Every mirage fact in the literature, image counts, inversions, towering, stooping, reads directly off the curve’s folds and slopes. The bench computes it by tracing 560 rays each time you touch a dial, and the probe turns it into a counting exercise a child can do.
The cases are quoted, and the physics is theirs. The 1597 sun, the Min Min headlights and the Marfa traffic are not analogies: each is the same integration this bench runs, at different dials. The one the bench cannot run, the Silent City, is in the file precisely because it was never a mirage at all.
And the limits are computed too. The angular window of the whole display is about ±0.4°, matching the survey’s statement that mirages live within about a degree of the horizon. The Earth-drop readout prices what the bulge hides at your distance; the D = 500 H bound and the real-source requirement close the file view. An explanation that states where it fails is the only kind this station shelves.
The formulas are textbook and integrated as written; the thresholds and image counts are computed live; the 1597 journal, the survey bounds and the hoax are quoted from the record; the silhouettes, the analytic profile and the shimmer are disclosed as modelling choices. What the bench refuses to do is turn a mechanism into a verdict. That mirages have explained famous lights is demonstrated, twice, with instruments; that they explain any particular sighting in any particular file is a case-by-case reading against bounds this bench computes for you. Both verdict cards hang at equal size, and the file stays open.
The dials that decide the picture
Four scenes and seven dials, each a physical quantity with a real-world anchor, not a mood.
- Standard air / Cold strait / Hot desert / Night duct. The baseline, the Fata Morgana, the inferior mirage and the UAP-shaped case, one click apart. Every preset is just a different set of dial positions, and the panel shows you exactly which.
- Inversion strength, 0 to 16 K. The sorceress’s only real knob. Six kelvin over a cold strait builds walls; zero returns the almanac’s horizon. The DUCTING chip flips exactly at the computed threshold.
- Base and thickness. The same kelvin spread over fewer metres bends light harder: thin, sharp layers are the mirage’s natural habitat, which is why the phenomenon lives in the first tens of metres over cold sea and night-cooled ground.
- Surface layer, -4 to +12 K. Positive is a sun-hammered road and the inferior mirage: an inverted sky under the horizon, read as water. Negative is the cold skin over a strait. One slider, both classic mirages, opposite signs of the same derivative.
- Observer height and target distance. The geometry dials. From a 3 m eye at 22 km, the bulge hides everything below about 20 m of the ship; climb the mast or close the range and watch the baseline change before the atmosphere touches anything.
The cases, as they stand
Five claims from the record, with who established each and where it lands. Two are solved, one is correlated, one was a hoax, and the last is the reading that runs the whole file.
| The 1597 Novaya Zemlya sun: a polar duct established by van der Werf et al., Applied Optics 2003 | SOLVED | Solved. Ray-tracing reproduced all three January observations with one common, realistic inversion, closing four centuries of doubt about de Veer’s journal. The file’s cleanest arc from tall tale to computed case. |
| The Min Min light: ducted headlights and fires established by Pettigrew, Clinical and Experimental Optometry 2003 | SOLVED | Reproduced on demand: a parked car’s headlights 10 km beyond a rise, floated over the horizon for six witnesses. The mechanism is demonstrated for the modern lights; the century of older reports is read through it, not proven by it. |
| The Marfa lights: US-67 traffic, lensed established by the UT Dallas SPS field study, May 2004 | CORRELATED | Strongly correlated over four instrumented nights, with a light produced on cue by a headlight flash. The study covers the lights seen from the viewing park; claims of pre-automobile sightings live outside its data and stay open. |
| The Silent City of Alaska: a mirage photographed established by Dick Willoughby, 1889 | HOAX | A hoax: the plate was Bristol, England, bought from a photographer. Retired, and kept on display as this file’s warning about how good a mirage story can look when someone is selling prints. |
| Mirage as a general UAP explanation established by Viezee’s survey for the Condon Report, 1969 | READING | Bounded, which is what makes it usable: within about 1° of the horizon, D = 500 H, a real source, stationary geometry. Sightings inside those bounds have a strong candidate; sightings outside them need something else. Per-case, always. |
Try this
- Watch the wall build. Cold strait preset, then drag the inversion slider slowly from zero to six kelvin. The ship looms, stretches, doubles, and locks into the stacked band. Somewhere on the way the DUCTING chip flips: that instant is the threshold the readout has been pricing all along.
- Break the mirage with your eye height. With the duct on, raise the observer from 3 m to 25 m. The stacked band collapses: you have climbed out of the light guide. Half of mirage lore, why the lookout sees nothing while the deckhand swears, is this one slider.
- Count the images honestly. Image Machine view, probe at the mast top. One crossing in standard air; three or more in the duct, some violet. Then check the scene view: the stacked band contains exactly the images the curve promised. Nothing about the picture is decoration.
- Run the night case. Night duct preset: town lights 40 km out, geometrically below the horizon, lifted into floating amber blobs that stretch and split as the shimmer breathes. Hold this next to any nocturnal-light report you have read, then open the File and see what happened when Min Min and Marfa met instruments.
- Find the inferior mirage. Hot desert preset: the sky folds under the dunes as false water, the commonest mirage on Earth. Now check the transfer curve: the fold is at the bottom of the picture and the inverted branch hangs below the erect one, the exact opposite of the strait. Same equation, opposite sign.
- End at the limits. File view, second verdict card: within about a degree of the horizon, D = 500 H, a real source, stillness. Then reread the first card. The distance between the two is where every per-case reading in this station’s files actually happens.
Accuracy
The honest line between what is measured, what the record reports, what is modelled here, and what is a reading:
| Feature | Tier | What that means |
|---|---|---|
| The refraction physics | T1 Measured | N = 79 P/T for optical air, the modified refractivity M = N + 0.157 z, and the ray equation y’’ = 10⁻⁶ dM/dz: textbook atmospheric optics, integrated exactly as written, in 30 m steps from your eye to the target. Every pixel of the scene view is one such integration. |
| The duct threshold | T1 Measured | For light to curve as fast as the Earth falls away, the inversion must beat roughly +0.11 K/m at 0 °C. The bench recomputes the exact figure from your temperature and pressure dials and prints it live; the DUCTING chip flips exactly when the profile crosses it. |
| The two field reproductions | T1 Measured | Min Min 2003: car headlights 10 km beyond a rise, ducted to six witnesses, published in a peer-reviewed optometry journal. Marfa 2004: light frequency matched to US-67 traffic, one produced on cue by a headlight flash. These are experiments, not anecdotes. |
| The 1597 journal | T2 Reported | De Veer’s dates and details are testimony from a 400-year-old logbook, tagged REPORTED; what upgraded the case is the 2003 Applied Optics ray-tracing that reproduced all three January observations with one realistic inversion. |
| The survey and its limits | T2 Reported | Viezee’s Condon Report chapter: images almost exclusively within about 1° of the horizontal, range bounded near D = 500 H, inversions of a few to 30 °C, stationary geometry required. Quoted as the survey states them. |
| The Silent City hoax | T2 Reported | Willoughby’s 1889 photograph of a city over Muir Glacier was a plate of Bristol, England. Kept in the file as the cautionary card: the century’s most famous mirage photo was a fake, while the real phenomenon needed no photograph at all. |
| The scenes and the profile | T2 Modelled | The ship, shoreline, town lights and dunes are this bench’s drawings; the temperature profile is a smooth analytic curve rather than a radiosonde; the shimmer is cosmetic noise standing in for turbulence. Each is tagged MODELLED in the panel. |
| What any given sighting was | T3 Reading | That mirages explain some nocturnal-light reports is documented; whether they explain any particular one is a per-case reading against the bounds this bench computes. The two verdict cards hang at equal size, and the bench adds no third. |
In one line: the refraction formulas, the duct threshold, the transfer curve and the two field reproductions are physics you can audit live on the bench; the 1597 journal, the Messina record, the survey bounds and the hoax are quoted from the record, tagged as reported; the silhouettes, the analytic profile and the shimmer are disclosed modelling choices; and whether any particular sighting in any particular file was ducted light is a per-case reading against computed bounds, on which this bench hangs two cards at equal size and adds no third. Build the wall, count the images, and decide for yourself.
Sources
- Standard atmospheric-optics references for the refraction formulas: optical refractivity N = 79 P/T (dry air, ~550 nm), modified refractivity M = N + 0.157 z, the flat-Earth ray transform, and the duct threshold near +0.11 K/m at 0 °C (Bean & Dutton, Radio Meteorology, for the shared machinery; Minnaert, Light and Colour in the Open Air; A. T. Young’s mirage literature).
- Gerrit de Veer’s journal of Barentsz’s third expedition (1596-97): the sun recorded on 24 January 1597, about two weeks early; the crew’s disbelief; the full disc seen by all on 27 January.
- W. van der Werf et al., "Gerrit de Veer’s true and perfect description of the Novaya Zemlya effect, 24-27 January 1597", Applied Optics 42, 379 (2003): the ray-tracing reproduction with one common temperature inversion.
- W. Viezee, "Optical Mirage: A Survey of the Literature", Section VI Chapter 4 of the Condon Report (Scientific Study of Unidentified Flying Objects, 1969): the mirage physics, the ~1° angular confinement, the D = 500 H range bound, and the inversion magnitudes.
- J. D. Pettigrew, "The Min Min light and the Fata Morgana", Clinical and Experimental Optometry 86, 109 (2003): the headlight reproduction with six witnesses under a nocturnal inversion.
- The May 2004 University of Texas at Dallas Society of Physics Students field study of the Marfa lights: traffic counters, video and chase cars; frequency matched to US-67 traffic; a light produced on cue.
- The Silent City of Alaska record: Dick Willoughby’s 1889 photograph identified as Bristol, England; the standard historical accounts of the hoax.
- The Fata Morgana name and the Strait of Messina record, including the classic 1643 Jesuit letter from the Reggio shore, from the standard optics-history accounts.
Build the wall from a ship. Then read where the explanation stops.
Open the interactiveCompiled July 2026