The Wow! Signal
On the night of 15 August 1977 a telescope in an Ohio field recorded a narrowband radio signal thirty times the noise, at the hydrogen frequency, rising and falling in exactly the shape Earth's rotation gives to a source fixed on the sky. It lasted 72 seconds, appeared in one feed horn of two, and has never been seen again. This instrument rebuilds the telescope, the night and the printout, stages every explanation on record, and lets you run the tests that keep it unexplained.
 Open the interactive ▸
 What you're looking at
The Drift view is the Big Ear at work, simplified but honestly clocked. The flat tiltable reflector and the fixed paraboloid face each other across the aluminum ground plane; two feed-horn beams rise to the sky; the stars, the Milky Way and the Sagittarius bulge drift through them as the Earth turns. The strip at the bottom is the receiver: it integrates the signal in 10-second windows and prints one character every 12 seconds, blank for noise, 1-9, then A-Z, the survey's actual code. When the sky-fixed source crosses the beam at the recorded strength, the strip prints 6EQUJ5.
The source selector is the point of the instrument. A point fixed on the sky traces the antenna pattern, a clean Gaussian, 36 s to half power, 72 s end to end. Ground RFI leaks in erratically and never matches; a satellite crosses in seconds; the comet cloud of the rejected 2017 claim is too faint and in the wrong place. The Profile-match cell in the status bar scores each one against the ideal pattern, which is the exact analysis that convinced the Big Ear team the signal came from the sky.
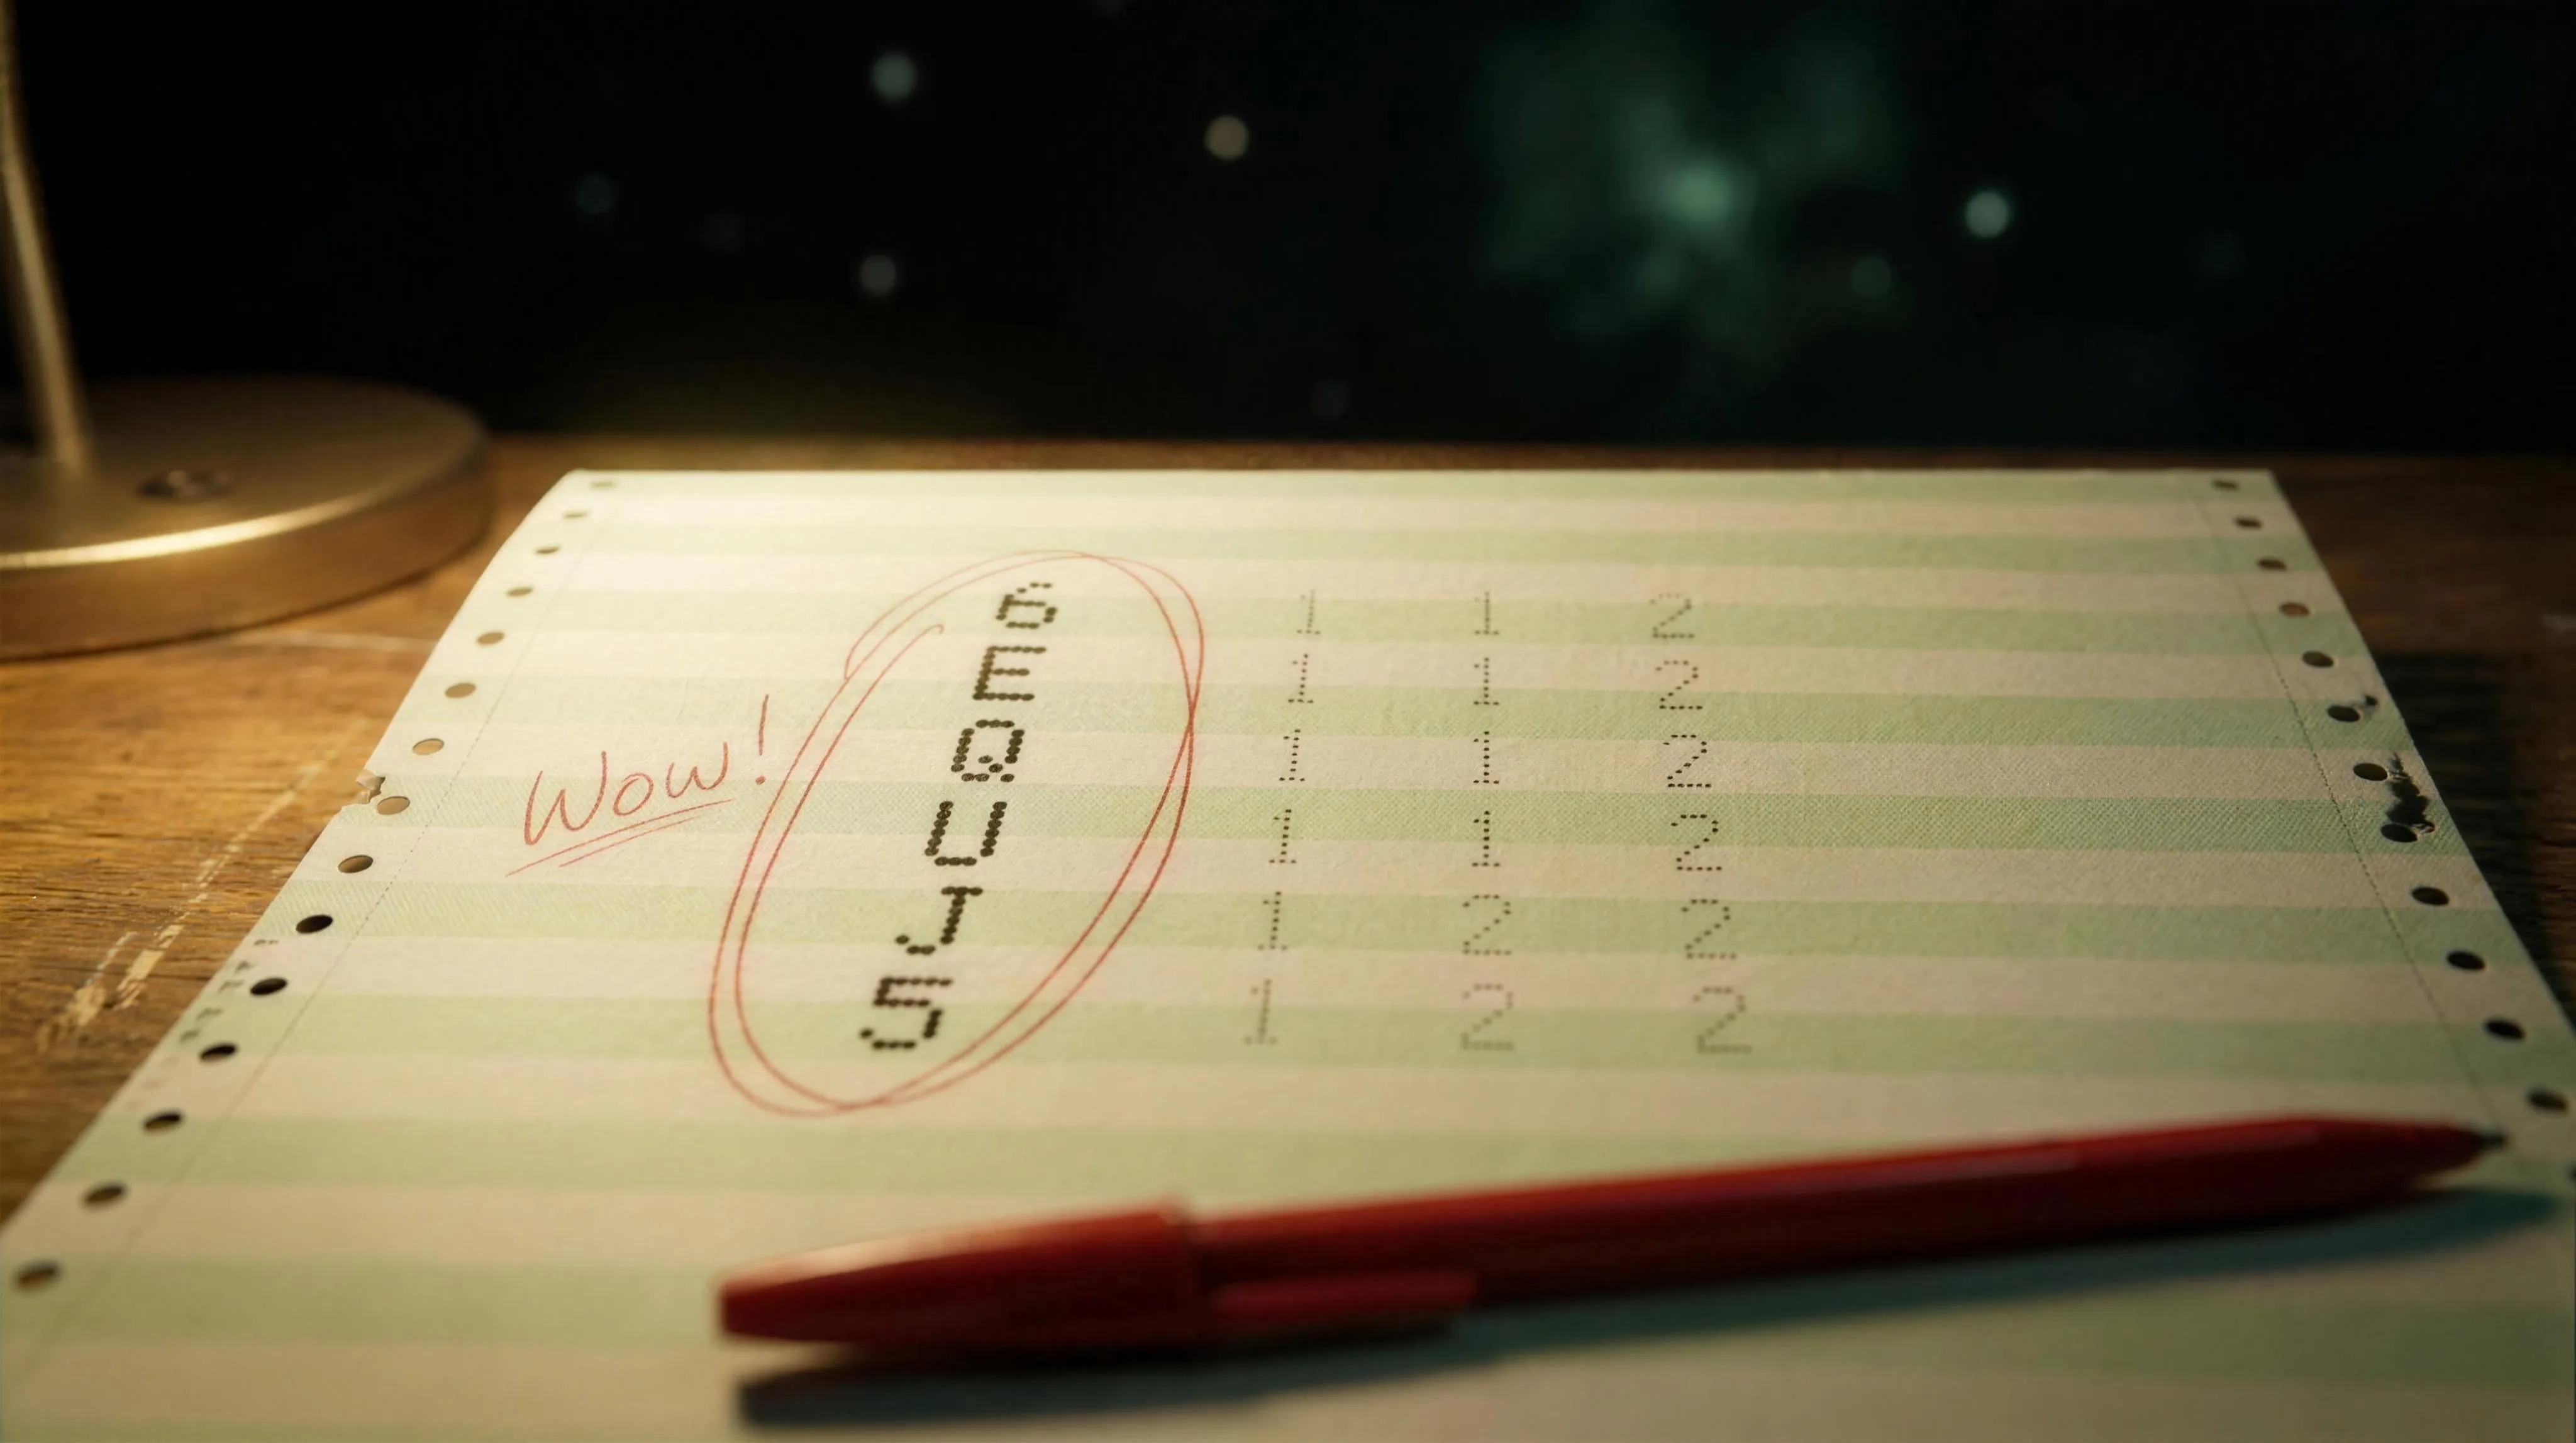
The Printout view is the record itself, rebuilt live: 50 channels of 10 kHz across a page of green-bar paper, one row every 12 seconds, sparse blanks and 1s of noise, and channel 2 slowly accumulating its six famous characters until the red pen circles them. Beside the paper, the analysis: the six recorded intensities laid over the ideal antenna pattern, and the band chart showing one lit channel beside the hydrogen line. Click any printed character for the intensity code.
Why it's here
This instrument holds down the radio wing of the site's SETI work. The Wow! signal left no photograph and no tape in circulation, only one page of printout anyone can inspect, and a telescope that no longer exists. That makes it a different kind of proving ground: when the evidence is six characters, how do you tell a signal from the sky from a signal from the ground. The answer is not in the characters but in their shape, a 72-second rise and fall that is exactly what Earth's rotation does to a fixed celestial source swept through a beam. Summarise, attribute, link; the verdict, as always, is yours.
It also closes a gap its siblings left open. The Drake Equation splits "is anyone transmitting" into seven numbers, and Wow! is the closest thing to a "yes" in that equation's sixty-five years of listening: once, then silence. The L in the equation, how long a civilisation stays on the air, is exactly what decides whether a beacon happens to be lit during the 72 seconds you are listening. ’Oumuamua is the other visitor that came once and refused to repeat; the two instruments share the same torment, a sample size of one. And The Laser Sail reminds you that we ourselves are now seriously engineering gigawatt directed beams aimed at other stars, which is the other face of the reading "somebody's transmitter." And Pulsar LGM-1 is this page's mirror: the same kind of anomaly on paper, ten years earlier, except it repeated every 1.3373 seconds and so was solved within months. That is exactly the test Wow! never got to take.
How it works
One idea runs the whole instrument: a telescope that cannot move sees a fixed sky source as its own beam pattern, played back at the speed of the turning Earth.
SNR(t) = A · exp( −4 ln 2 · (t − t₀)² / W² ) · with · W = HPBW / (15.04″/s · cos δ) ≈ 36 s
The Earth is the drive motor. Big Ear's beam was about 8 arcminutes wide in right ascension. At declination −27° the sky drifts through it at 15.04 × cos(27°) ≈ 13.4 arcseconds per second, so a fixed source takes ~36 s to cross the half-power width and ~72 s to rise from the noise and sink back. Those numbers are not tuned to fit the event; they are the telescope's geometry, and the event fit them.
The characters are integrations, not samples. The receiver averaged each channel for 10 seconds, spent 2 seconds processing, and printed the average as one character: blank below 1 sigma, 1-9, then A for 10 up to Z for 35. The instrument does the same arithmetic, including the dilution: a seconds-long satellite burst averaged over a 10-second window shrinks, which is one reason the satellite reading fails.
The six values include that night's noise. A noiseless Gaussian through the beam floors to 3-13-26-29-19-7, not 6-14-26-30-19-5. The recorded sequence differs from the ideal curve by about one sigma per sample, exactly as it should. The reconstruction adds the recorded residuals so the default pass prints the historical characters; drag the peak slider and the characters recompute from the geometry.
The bandwidth test is arithmetic, not rhetoric. All the power sat in one 10 kHz channel. Spread the same power across the 50-channel band and each channel gets a fiftieth: a 30-sigma spike becomes 0.6 sigma of nothing. So either the source was intrinsically narrowband, which in nature means a maser and in engineering means a transmitter, or it was bright across the band and would have been catalogued long ago.
The evidence is tagged as you go. The bottom-left table is the conscience of the sim. The printout, the profile match, the narrowband frequency and the null follow-ups are MEASURED; this reconstruction and the failure modes of the rejected scenarios are MODELLED; what sent it is a READING. Rows light up as you touch the matching control, so you always know which kind of claim you are looking at.
The printout is measured; the profile match is measured; the bandwidth and the band are measured; the silence since is measured. The beam model and the failure modes are modelled. What transmitted, a technology, a natural maser, a scintillated twinkle, is a reading, and forty-nine years of follow-up have refused to settle it. The staging, a legible telescope under an exaggerated sky, is the only liberty, and it is labelled where it happens.
The four things over the antenna
Four sources, from the celebrated to the mundane, each run through the same receiver so you can compare them fairly.
- Sky-fixed source. A point that hangs on the celestial sphere while the Earth turns. It traces the antenna pattern exactly: 72 seconds, one clean Gaussian, 6EQUJ5 at the recorded strength. This is not an explanation; it is the geometry every explanation must reproduce.
- Ground RFI. A transmitter leaking through the sidelobes: erratic bursts, no beam shape, back again the next night. It fails the profile, and it would have to be transmitting inside a band that is legally silent worldwide. Ehman’s space-debris reflection is this scenario’s one stubborn loophole.
- Satellite. A moving transmitter crosses an 8-arcminute beam in a couple of seconds; averaged over the receiver’s 10-second window it barely registers, and its Doppler drift smears it across channels. The clock rejects it before the band does.
- Comet cloud. The 2017 claim, staged at its published geometry: a broad, faint hydrogen cloud in the wrong place. It cannot reach thirty sigma, it does not trace the beam, and the field has dismissed it. It is here because a rejected hypothesis, honestly staged, teaches more than a strawman.
The hypotheses
Every serious explanation on the record, with who put it forward and where it stands. Neutral, attributed, and no verdict: the reading is yours.
| An ETI transmission proposed by the survey’s own premise; Kraus & Ehman, cautiously | READING | A reading. The band, the bandwidth and the profile all permit it; a single detection proves nothing, and Ehman himself declined to conclude it. |
| Interstellar scintillation of a weak steady source proposed by Cordes, Lazio & Sagan 1997 | LIVE | Live. A twinkle can inflate a faint beacon once and never again; but deeper searches at the position found no underlying source. |
| A hydrogen cloud brightened by a transient (natural maser) proposed by Méndez et al. 2024, the Arecibo Wow! project | LIVE | Live. Archival Arecibo data show similar narrowband hydrogen signals; a magnetar flare stimulating a cold cloud could mimic the event. Under scrutiny. |
| Ground RFI reflected off space debris proposed by Ehman’s own conservative fallback | DISFAVOURED | Strained. Transmission at 1420 MHz is banned worldwide, the profile matches the sky, and it never recurred; hard to rule out, hard to make work. |
| A satellite or aircraft transmission proposed by considered and dismissed in the first analyses | DISFAVOURED | Disfavoured. Anything moving crosses an 8-arcminute beam in seconds, not 72, and nothing lawful transmits in the protected band. |
| Hydrogen clouds around comets 266P and P/2008 Y2 proposed by Paris 2017 | DISFAVOURED | Rejected. Wrong position, wrong brightness, wrong mechanism; refuted by the Big Ear team and radio astronomers on the record. |
Try this
- Watch a clean pass. Leave everything at default and watch the strip: the trace climbs the dashed antenna pattern, and six characters print, 6, E, Q, U, J, 5. That is the whole event, at the recorded strength, on the recorded clock.
- Try to fake it from the ground. Switch to Ground RFI and watch the profile-match cell collapse. Bursts, plateaus, comebacks: everything but a single clean crossing of the beam. This is the argument that moved the needle in 1977, in one number.
- Run the bandwidth test. Flip Narrow to Broad. The strip flattens and, in the Printout view, the whole page goes quiet: the same power spread over fifty channels is 0.6 sigma of nothing. Narrowband is not a detail; it is the second-strongest fact on the record.
- Fire the second horn. Toggle the steady source and watch horn B answer three minutes after horn A, the negative twin deflection the real record conspicuously lacks. Whatever it was, it was not steadily on.
- Weaken it. Drag the peak from 31 sigma down toward 5 and watch the characters dissolve into the noise floor. At 5 sigma the event is a "4" nobody circles. The Wow! signal is famous partly because it was strong enough to be unarguable.
- End on the Printout. Switch views and wait one pass. Blanks, 1s, a lone 2, and then channel 2 quietly stacks 6EQUJ5 and the red circle closes around it. That page is the entire corpus of evidence, and you have just watched every character of it being computed.
Accuracy
The honest line between what has been measured, what is modelled here, and what is a reading:
| Feature | Status | What that means |
|---|---|---|
| The printout: 6EQUJ5 in channel 2, 15 August 1977 | Measured | The record itself. Six characters, one per 12 seconds, in one 10 kHz channel of fifty; U means the 10-second average ran 30 sigma above the noise, the strongest the survey ever printed. The page survives in the Ohio History Connection archive. |
| The 72 s profile matches the antenna pattern | Measured | Big Ear could not steer; the Earth swept its beam across the sky at 13.4 arcseconds per second at that declination. A fixed celestial source must rise and fall as the beam pattern does, half power in ~36 s, and the six intensities fit that curve. Ground interference does not know the beam's shape. |
| Narrowband, ≤10 kHz, at ~1420.456 MHz | Measured | All the power sat in a single channel beside the 1420.406 MHz hydrogen line, inside the internationally protected 1400-1427 MHz band where transmission is banned. Two frequency values exist on the record (Ehman 1420.356, Gray 1420.456) because of a documented local-oscillator bookkeeping issue; both sit beside the line. |
| One horn, one pass; more than fifty follow-ups, all null | Measured | The two feed horns pointed ~3 minutes of transit apart; a steady source must appear in both, and the record shows one, with no way to tell which. Big Ear re-observed the spot 50+ times; Gray with META and the VLA, Gray & Ellingsen from Hobart: nothing. Whatever it was, it was not on when anyone looked again. |
| This reconstruction: a Gaussian beam swept by sidereal drift | Modelled | The instrument computes the SNR profile from the beam response and Earth's rotation, integrates it in 10-second windows, and prints the characters by the survey's own code. The six recorded values include that night's noise; the model reproduces them with the recorded residuals, not by hand animation. |
| The failure modes of RFI, satellites and the comet reading | Modelled | The rejected scenarios are modelled honestly enough to fail on screen the way they fail on paper: interference is erratic and persistent instead of one clean beam crossing, a satellite crosses in seconds, a comet cloud is orders of magnitude too faint and was not at the position. |
| What sent it: a technology, a natural maser, a scintillated twinkle | Reading | An ETI transmission fits everything and proves nothing. Interstellar scintillation of a weak steady source explains a one-off but the steady source was never found. The 2024 Arecibo Wow! reading proposes a hydrogen cloud brightened by a transient, a natural narrowband mechanism now under scrutiny. The choice among them is a reading. |
| The 2017 comet hypothesis (266P/Christensen) | Contested | Antonio Paris proposed cometary hydrogen clouds crossing the beam. Radio astronomers and the surviving Big Ear team rejected it: the comets were not at the recorded position, cometary hydrogen is far too faint for a 30-sigma spike in 10 kHz, and the claim's supporting observations did not withstand review. Presented as contested and, by the field, dismissed. |
In one line: the printout and its six characters, the 72-second profile that matches the antenna pattern, the narrow bandwidth beside the hydrogen line in a protected band, the single horn and the fifty-plus empty follow-ups are all measured; this reconstruction and the failure modes of interference, satellites and comets are modelled from those measurements; and what transmitted, a technology, a natural hydrogen maser, or a scintillated twinkle of something faint, is a reading on which the record has refused, for forty-nine years, to rule. The instrument takes no side.
Sources
- Cocconi, G., & Morrison, P. (1959). Searching for Interstellar Communications. Nature 184, 844. The founding argument: listen at 1420 MHz, where hydrogen hums and any radio engineer would meet.
- Kraus, J. D. (1979). We Wait and Wonder. Cosmic Search 1, No. 3. The telescope’s designer tells the story of the signal, in the observatory’s own magazine.
- Ehman, J. R. (1997, revised 2010). The Big Ear Wow! Signal: What We Know and Don’t Know About It After 20 Years / 30th Anniversary Report. The discoverer’s own analysis: the characters, the frequency, the local-oscillator issue, the profile fit, and his refusal to draw vast conclusions.
- Gray, R. H. (2012). The Elusive Wow: Searching for Extraterrestrial Intelligence. Palmer Square Press. The book-length treatment, and the source of the corrected 1420.4556 MHz value.
- Gray, R. H. (1994). A Search of the ‘Wow’ Locale for Intermittent Radio Signals. Icarus 112, 485. The first dedicated follow-up campaign.
- Gray, R. H., & Marvel, K. B. (2001). A VLA Search for the Ohio State ‘Wow’. ApJ 546, 1171. The Very Large Array pointed at the spot: nothing.
- Gray, R. H., & Ellingsen, S. (2002). A Search for Periodic Emissions at the Wow Locale. ApJ 578, 967. Fourteen 14-hour sessions from Hobart, Tasmania: nothing periodic.
- Cordes, J. M., Lazio, T. J. W., & Sagan, C. (1997). Scintillation-induced Intermittency in SETI. ApJ 487, 782. How interstellar scintillation can make a steady beacon appear once and vanish.
- Oliver, B. M., & Billingham, J. (1971). Project Cyclops: A Design Study. NASA CR-114445. The "water hole" framing of the quiet band between the hydrogen and hydroxyl lines.
- Paris, A. (2017). Hydrogen Clouds from Comets 266/P Christensen and P/2008 Y2 (Gibbs) are Candidates for the Source of the 1977 “WOW” Signal. Journal of the Washington Academy of Sciences. The comet claim, presented here as what it is: contested, and rejected by the field.
- Méndez, A., Zuluaga, J. I., et al. (2024). Arecibo Wow! An Astrophysical Explanation for the Wow! Signal. arXiv preprint. The natural-maser reading: cold hydrogen clouds briefly brightened by a transient, seen in archival Arecibo data.
- ITU Radio Regulations, footnote 5.340. The 1400-1427 MHz band: all emissions prohibited, worldwide, to protect hydrogen-line astronomy.