Deep Time
Claims written into ice, stone and star charts, weighed against what the record can actually carry.
LIVE 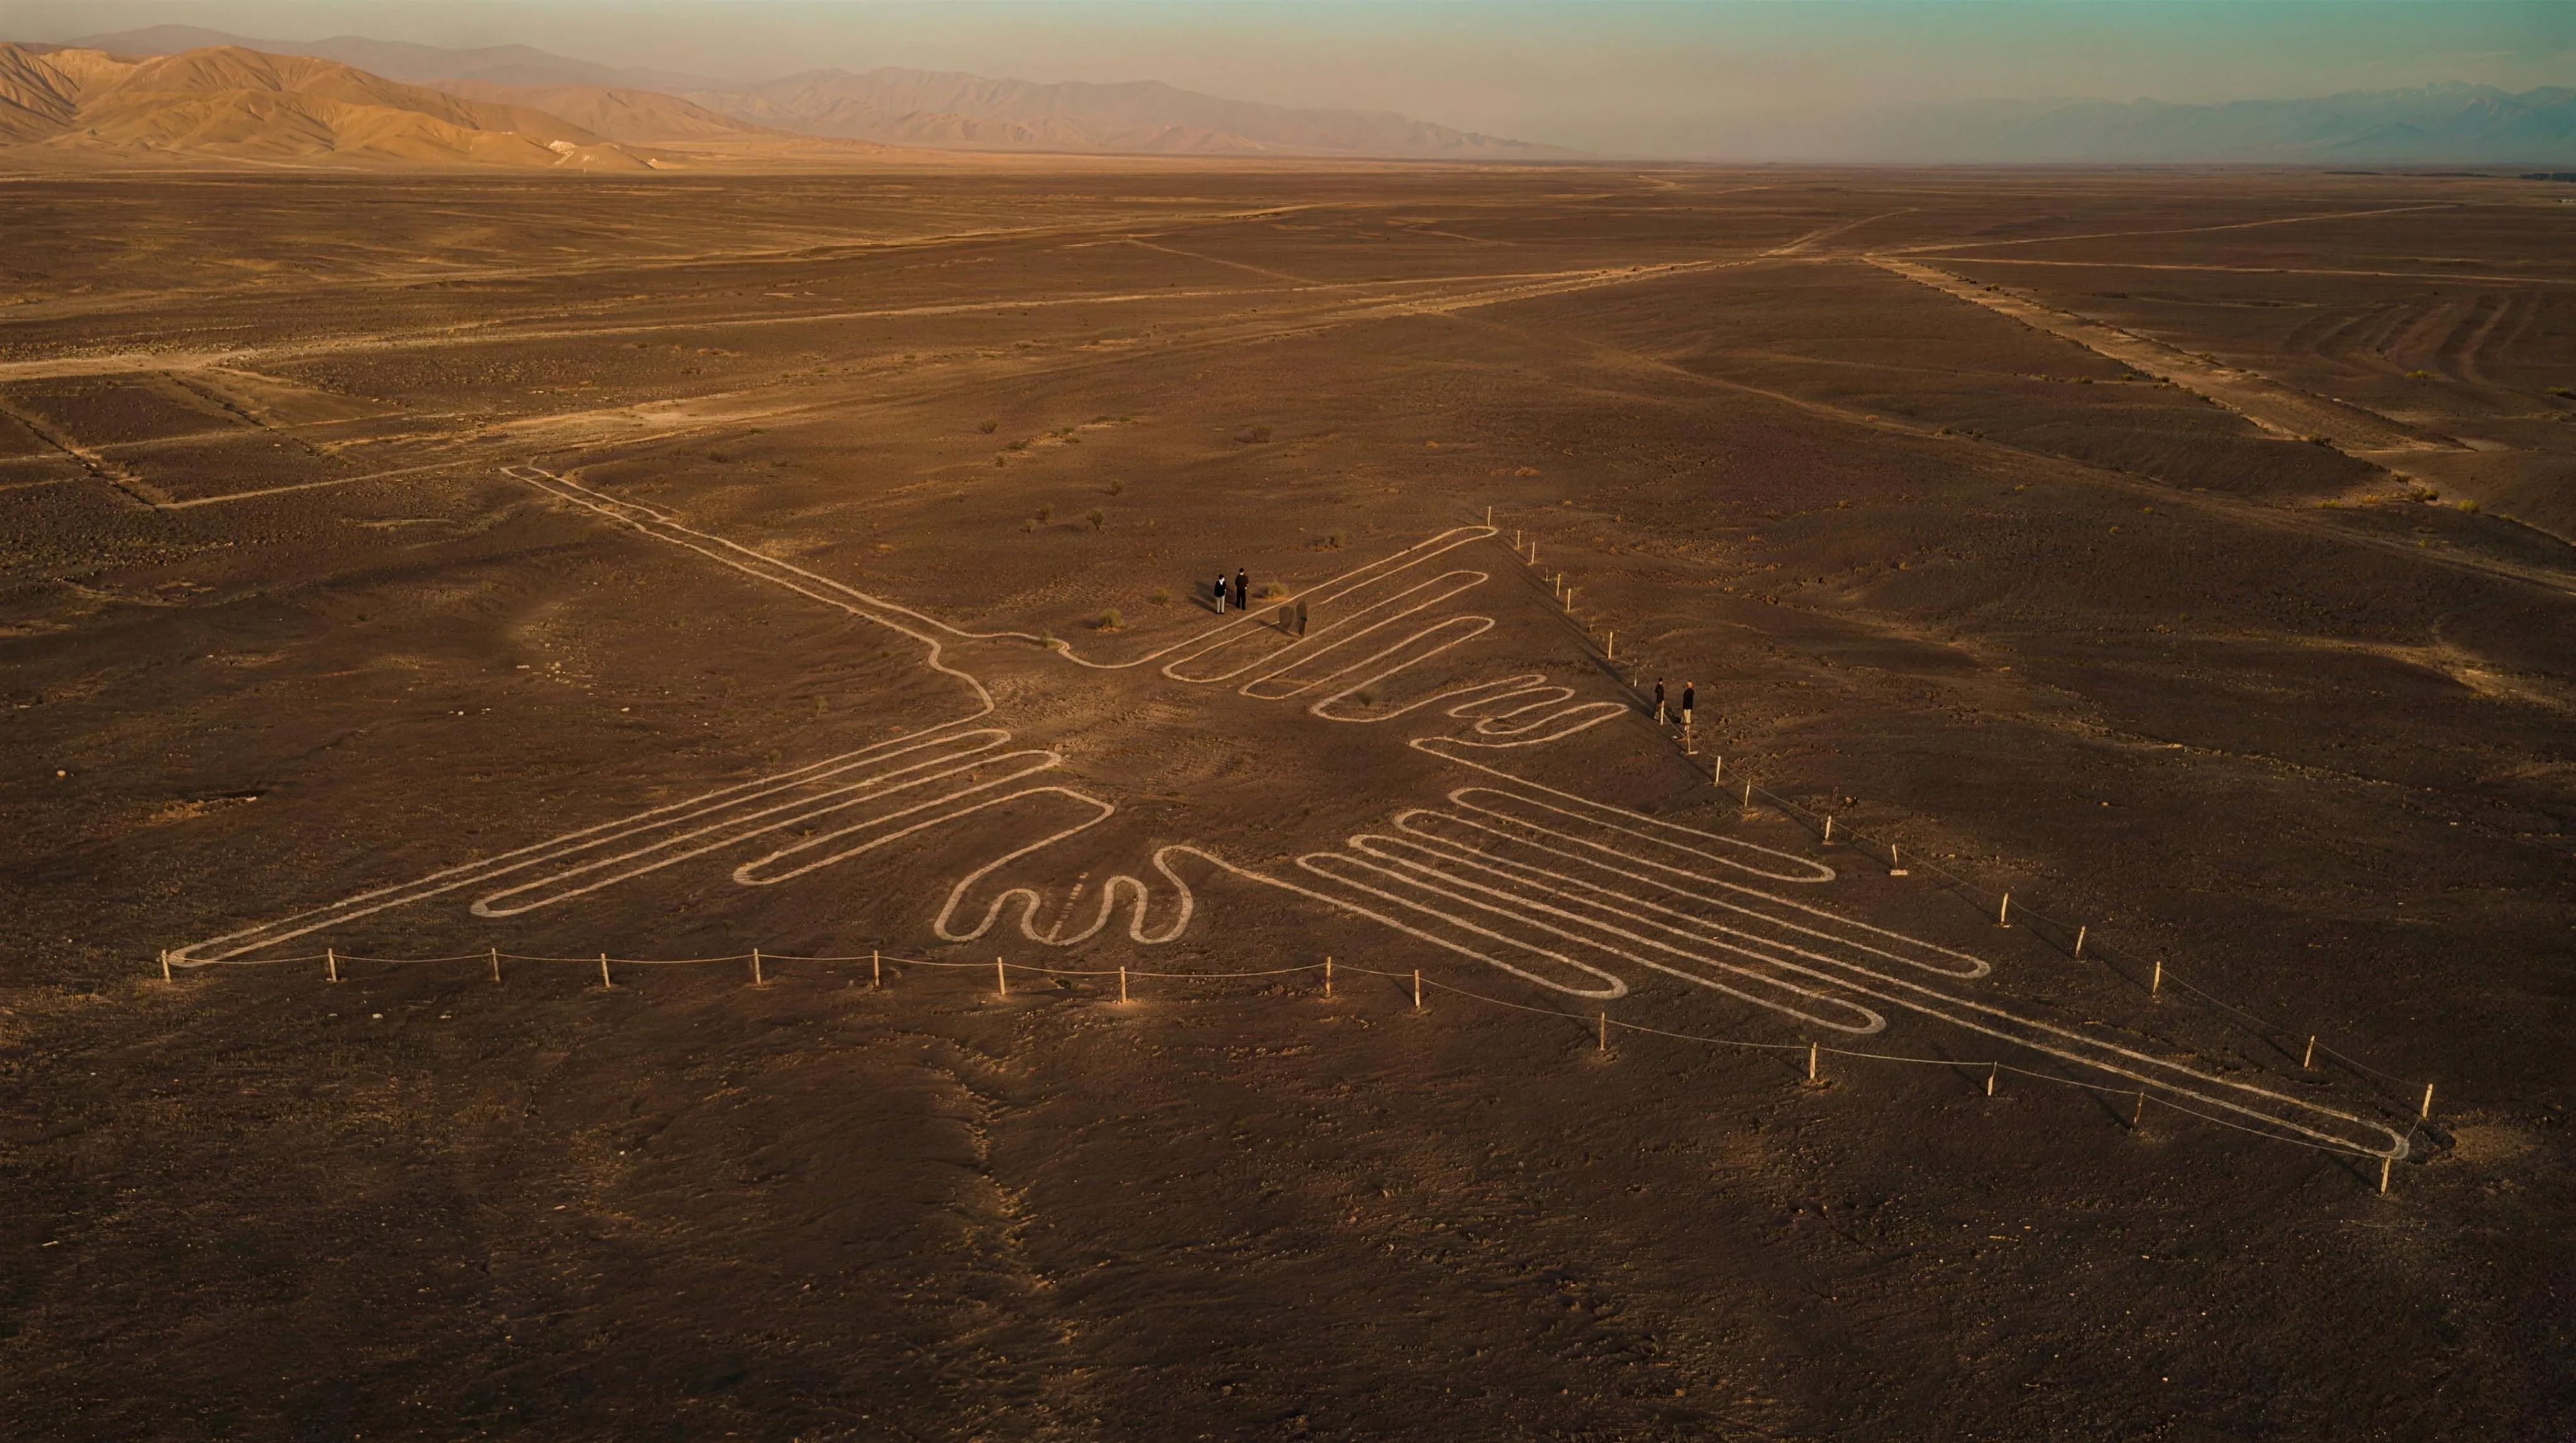 The Nazca Construction Bench NAZCA PAMPA · 500 BC–AD 500 · INST-58 The pampa's lines and figures as a construction-arithmetic problem. The Plot view drives the stakes live: centre-line coordinates whose errors refuse to add (RMS = σ at any size), the peg-to-peg chain random-walking to a σ√N closure gap, and the kilometre straightaways held to under two metres by a 1-arcminute naked eye. The Ground view is 3D: from a 1.6 m standing eye through Reiche's ladder, the 13 m Mirador, the bordering rises and the after-check Cessna, with foreshortening read live. The Labour view prices every job at the measured 1984 clearing rate: the hummingbird at a dozen person-days, the whole pampa at ~257 person-days a year across the drawing centuries, and Nickell's 1982 crew of six staking a full-size condor in nine hours. The File view lays out the claims: the runway that began as a joke, Hawkins' 39 hits against 37 free from chance, and the water-and-pathways reading that leads the archaeology. Two verdicts at equal size: the construction never needs the air; why they drew stays open. LIVE
 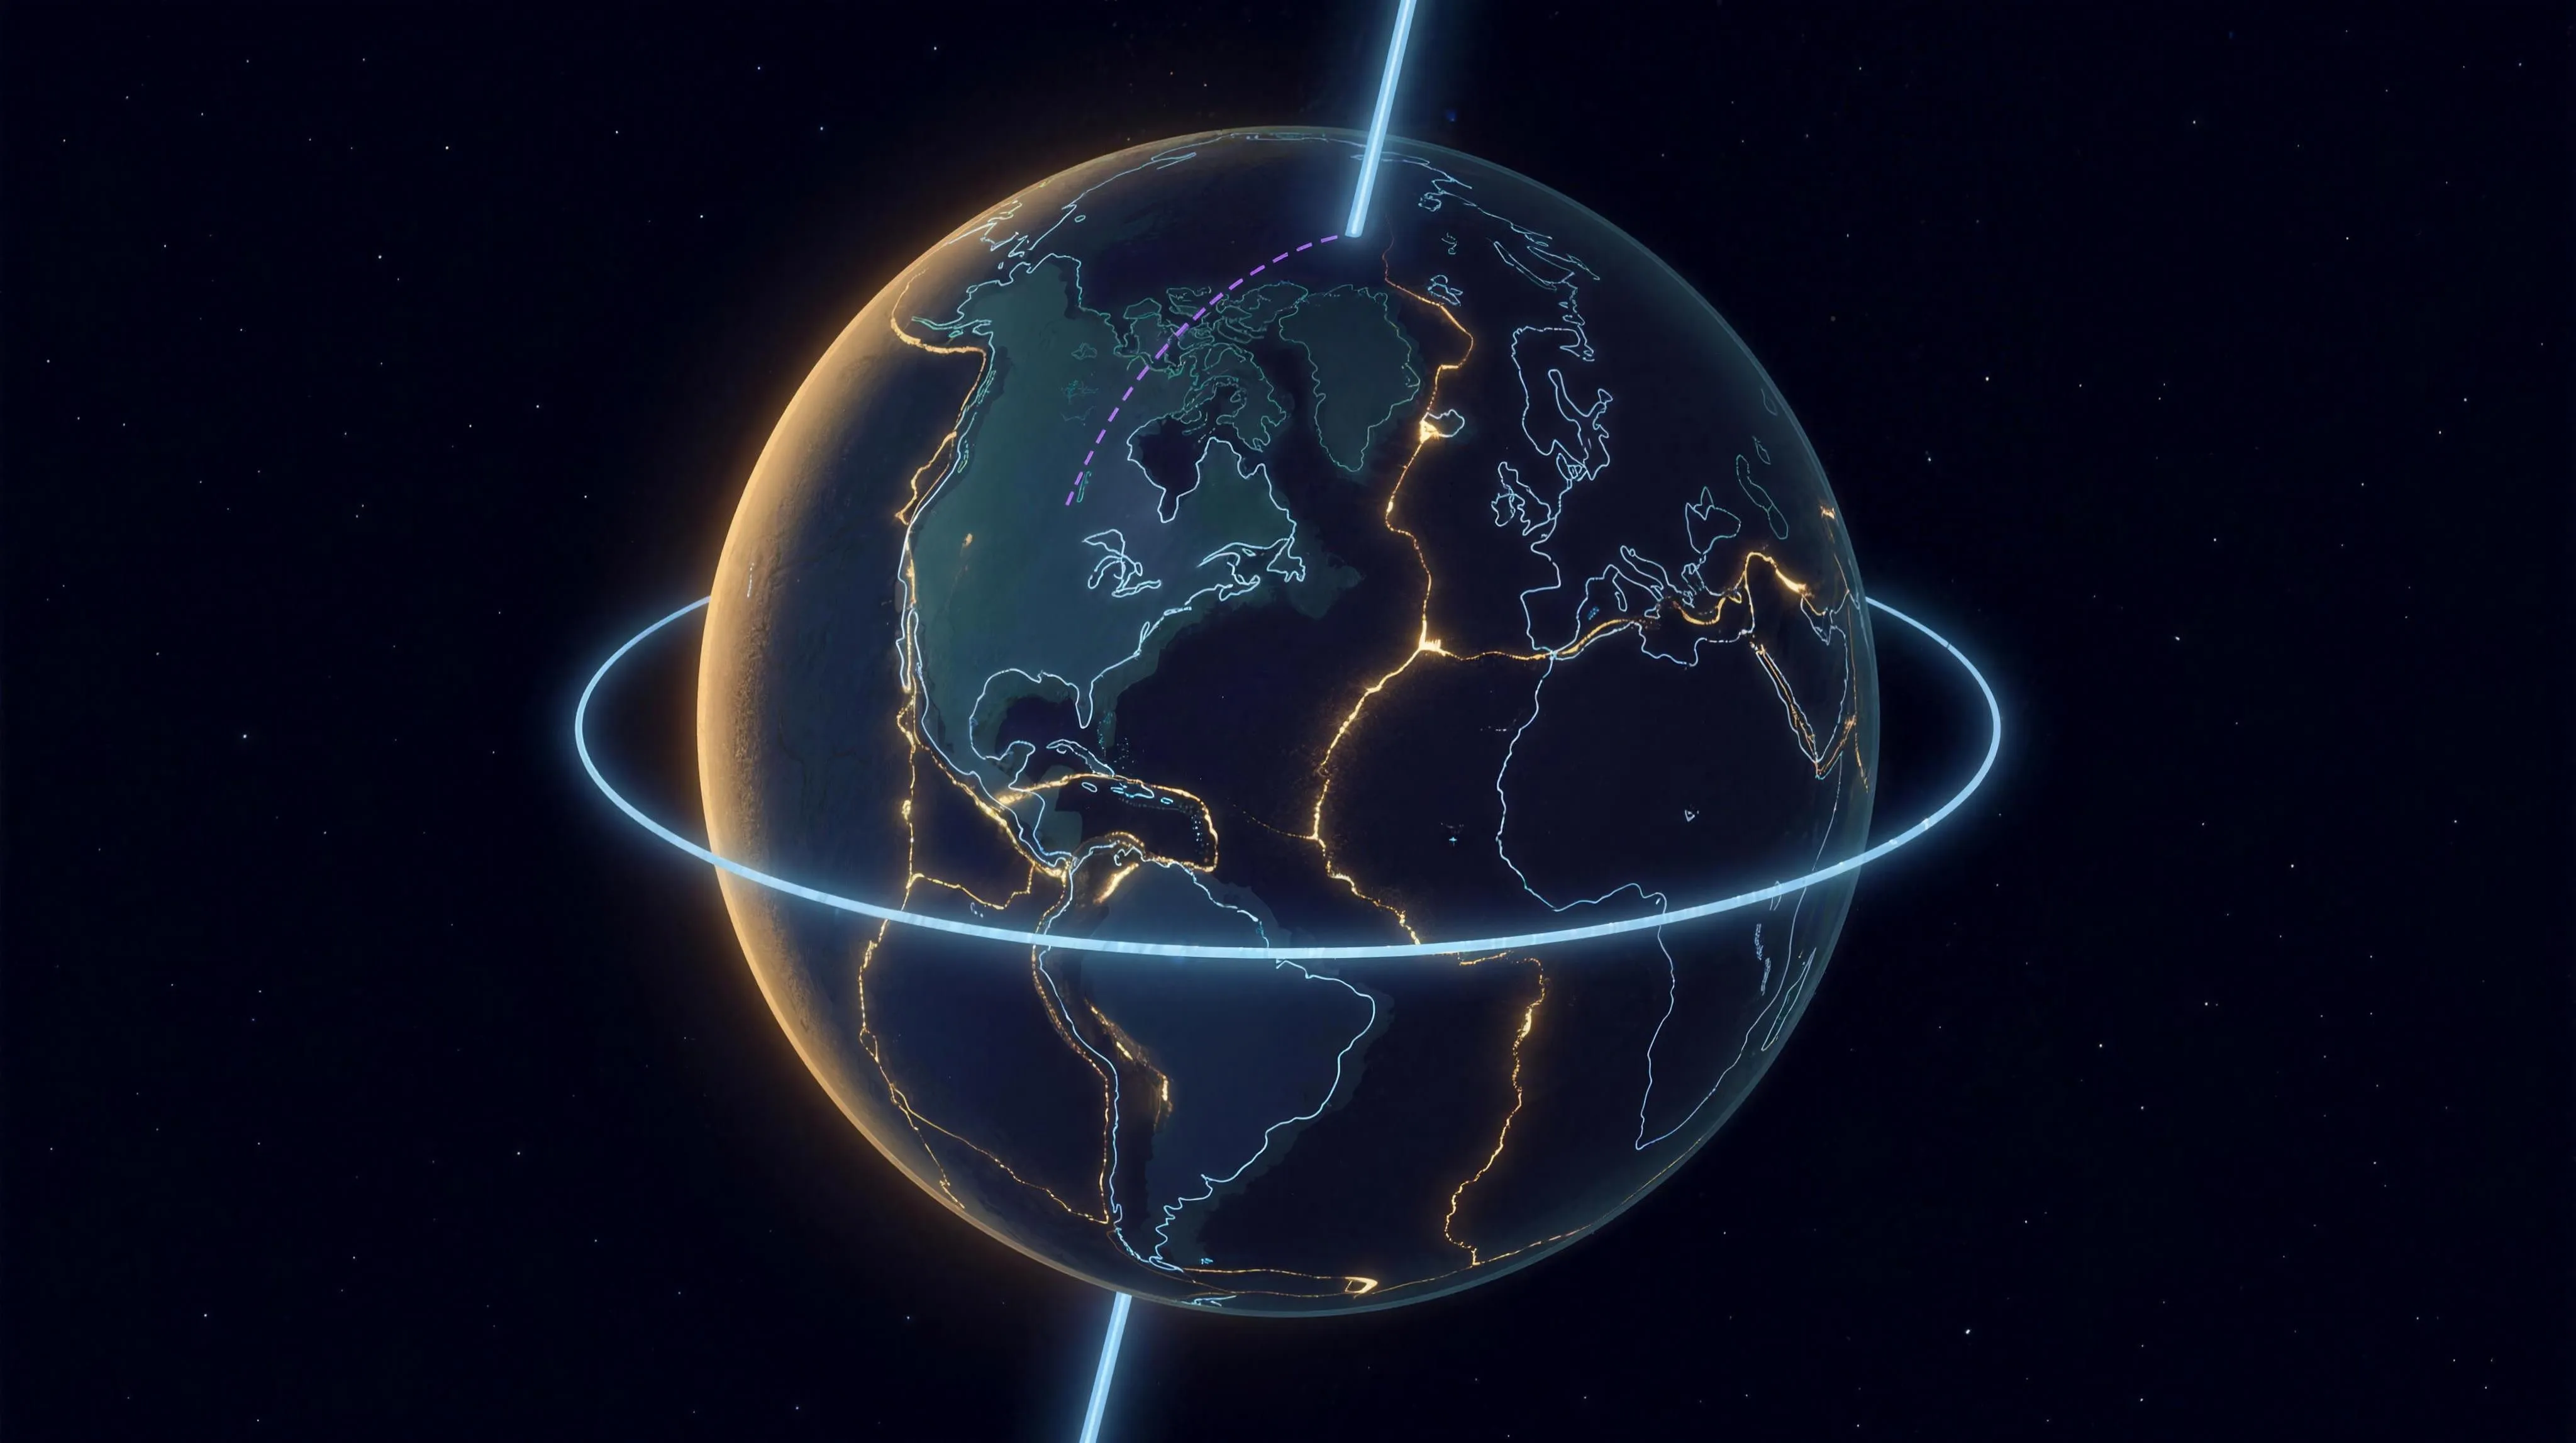 Earth's Shifting Crust CRUST DISPLACEMENT · 1958 · INST-57 Charles Hapgood's 1958 hypothesis, with Einstein's foreword, on which Hancock staked a civilisation in 1995: the whole crust can slide 30 degrees in a few thousand years. This instrument runs it at face value. The Globe view replays the claimed slide on a real-coastline Earth: geography moves, the rotation axis and climate rings stay put, Hudson Bay exits the polar circle as Antarctica enters it, and a misfit heat-map prices the rotated shell against the equatorial bulge per pixel, closed form, up to 10.7 km. The Engine view runs the book's own ice-cap motor to the end: the off-axis centrifugal thrust supplies about 900 pascals at its kindest, the pressure of a hand resting on a table, while sliding at the claimed speed demands about 1.4 GPa, a gap of 1.5 million; run forward, the engine buys 0.43 mm a year, pricing the claimed 30 degrees at 7.7 billion years, longer than the age of the Earth. The Records view sets the claim on the rate ladder: every measured motion of the solid Earth reads centimetres per year, the Greenland cores count layer by layer through the claimed dates without a seam, and the Antarctic ice is continuously layered for over 800,000 years. The File walks 1958 to 2015: Einstein's foreword names the only doubtful assumption itself, the author withdraws his own engine in 1970, Hancock switches to the Younger Dryas impact in 2015, and the measured pole drifts toward Hudson Bay today at ten centimetres a year, the claimed direction at one millionth of the claimed rate. Two verdicts at equal size; the reading is yours. LIVE
 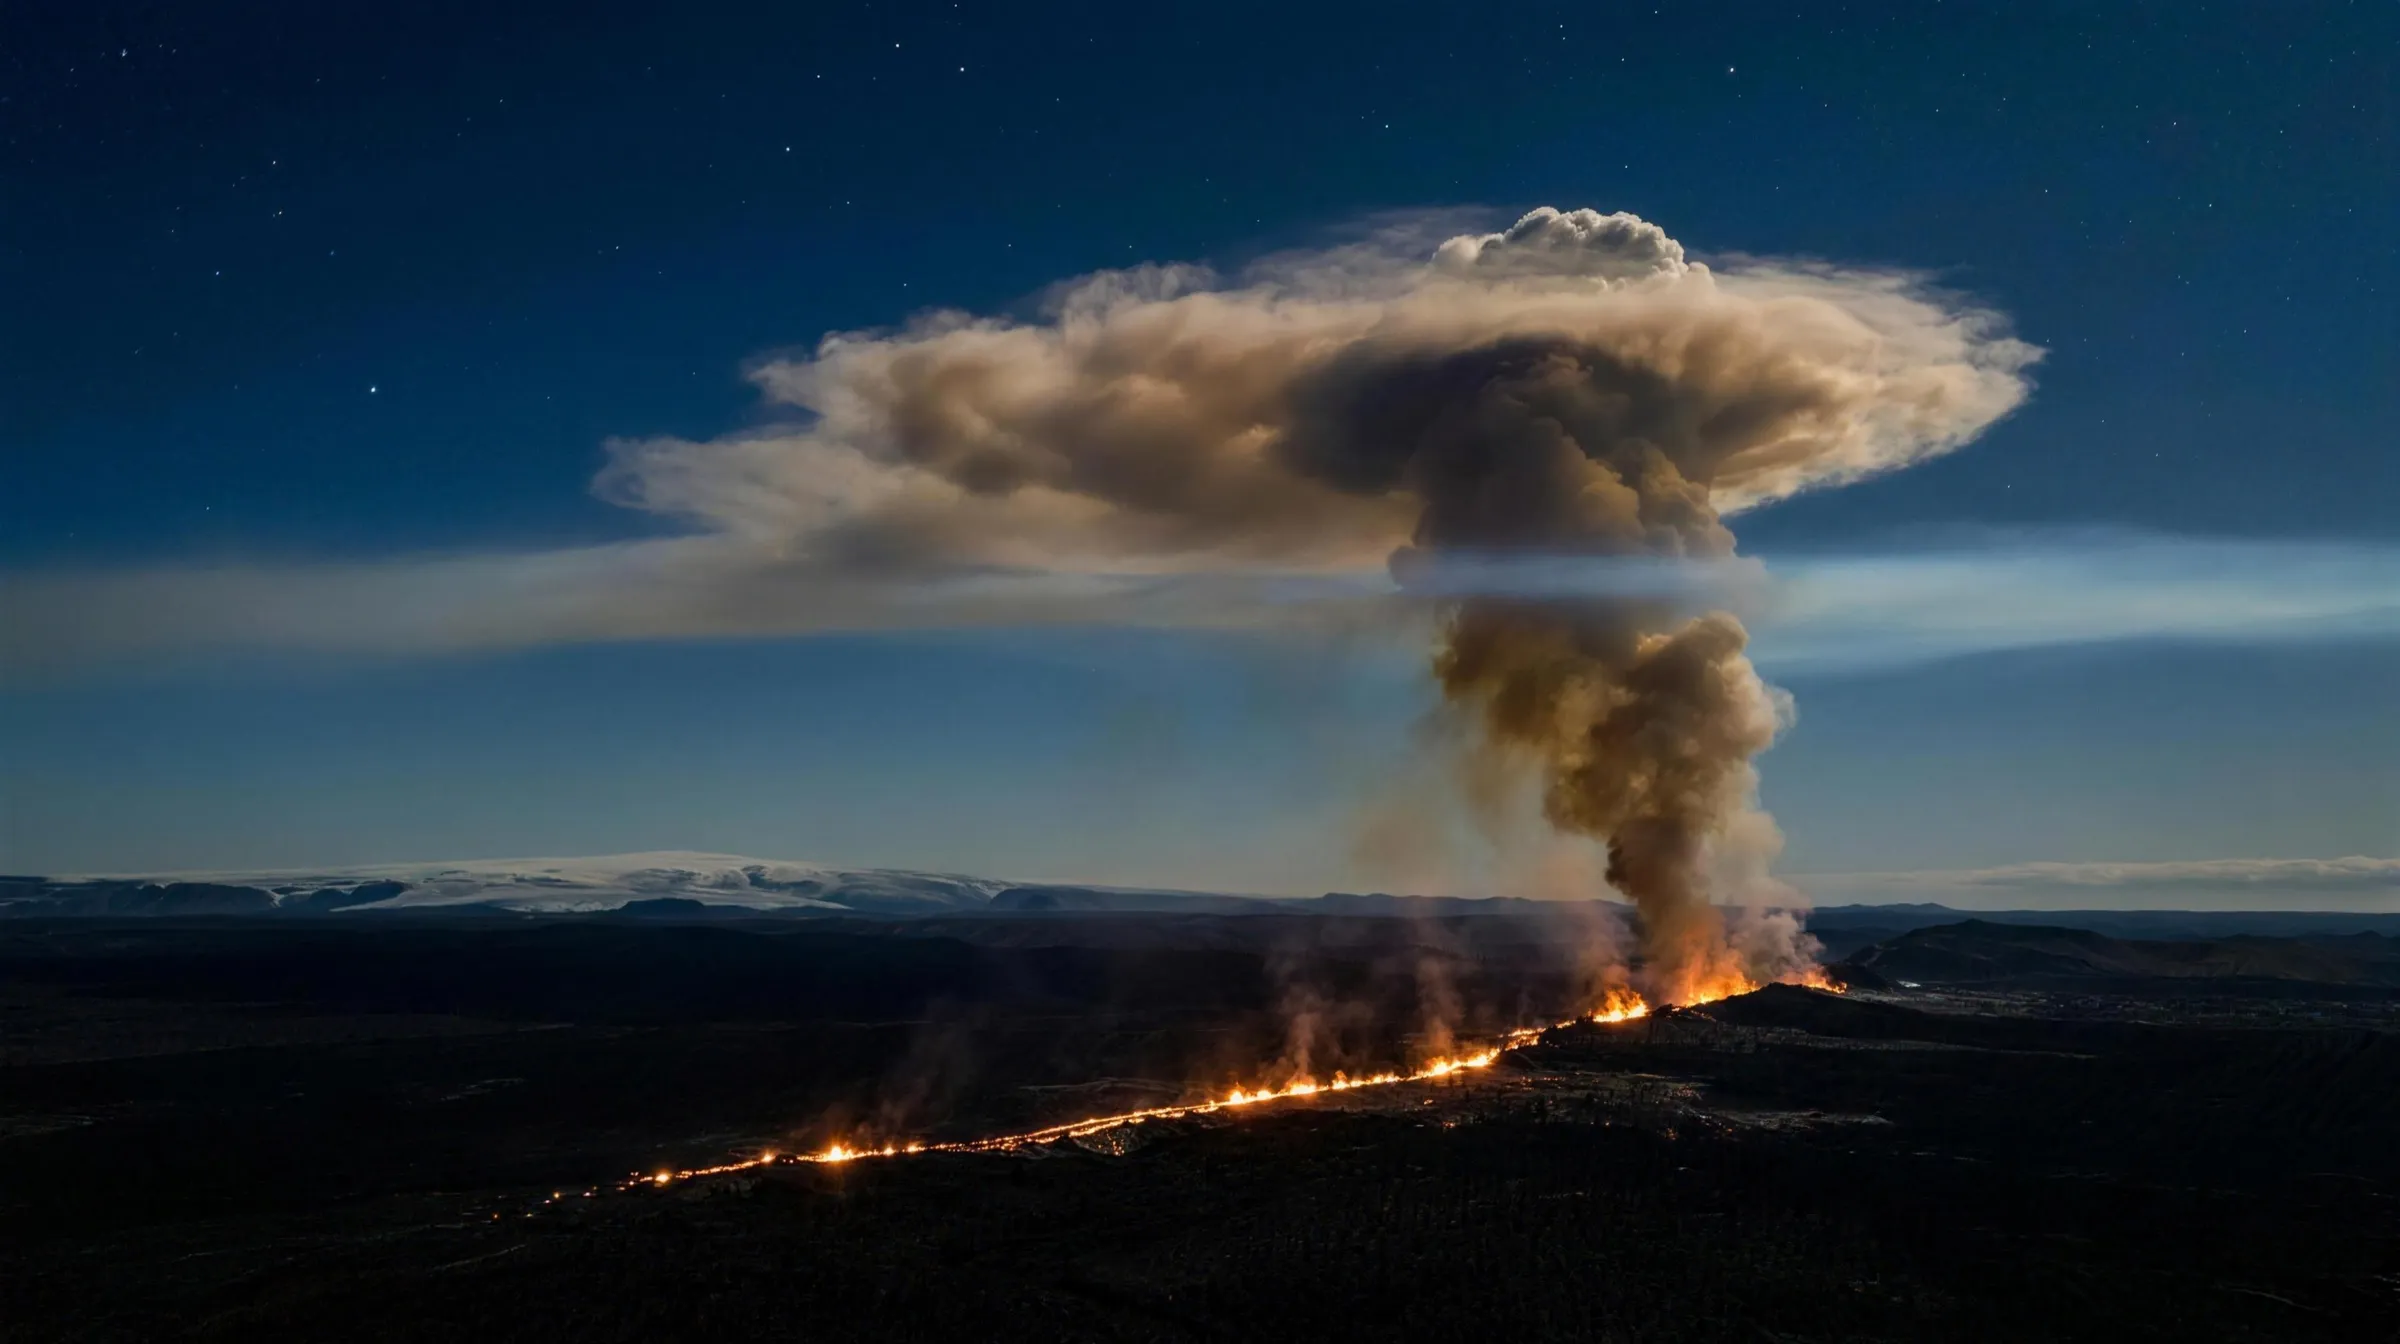 The Osmium Fingerprint FISSURE VS IMPACT · INST-48 INST-46 closed on one undisputed measurement: a platinum spike in Greenland ice that rose a hundredfold over fourteen years, cause unknown. This sequel tries the remaining suspect with the same rigour the impact got: a crack in the ground in Iceland. The Fissure view builds the whole machine at true scale, one unit per kilometre: the famous curtain of fire is a few hundred metres of base, the convective column above it plays against a 9 km subpolar tropopause, about 500 m³/s of column feed clears it, and the three-week channel to Summit, 1,247 km away, is not a model, because Laki demonstrated it in 1783 and Hekla repeated it in 1991, writing a platinum peak into a snow pit at the exact GISP2 site; the control case, Holuhraun, released eleven megatons of SO₂, never topped 4 km, and delivered nothing. The Mixing Bench runs Sun 2020 as a machine: meteorite and mantle are degenerate in the osmium isotope, both near 0.13, but the chondrite fraction that supplies the osmium must deliver iridium at CI proportions, 250 times the measurement, while volcanic gas condensate takes the osmium alone, and the deepest sample at 0.12 sits below anything a chondrite mixture can reach. The Record draws both published tables to the last row: five horizons in four thousand years where an impact predicts one, the 152-154 cm gap shaded rather than smoothed, the disagreeing same-depth replicates in both camps' tables joined in red, and beneath it Abbott 2021's eight bipolar sulfate events, V8 at twice Okmok twenty-five years before the onset, with the platinum spike forty-eight years after it, too late to be anyone's trigger. The File runs 2013 to 2026 in nine cards and two verdicts at equal size: a fingerprint without a culprit, a sheet without a crater. The numbers are sourced, the anchors are re-runnable, and the reading is yours. LIVE
 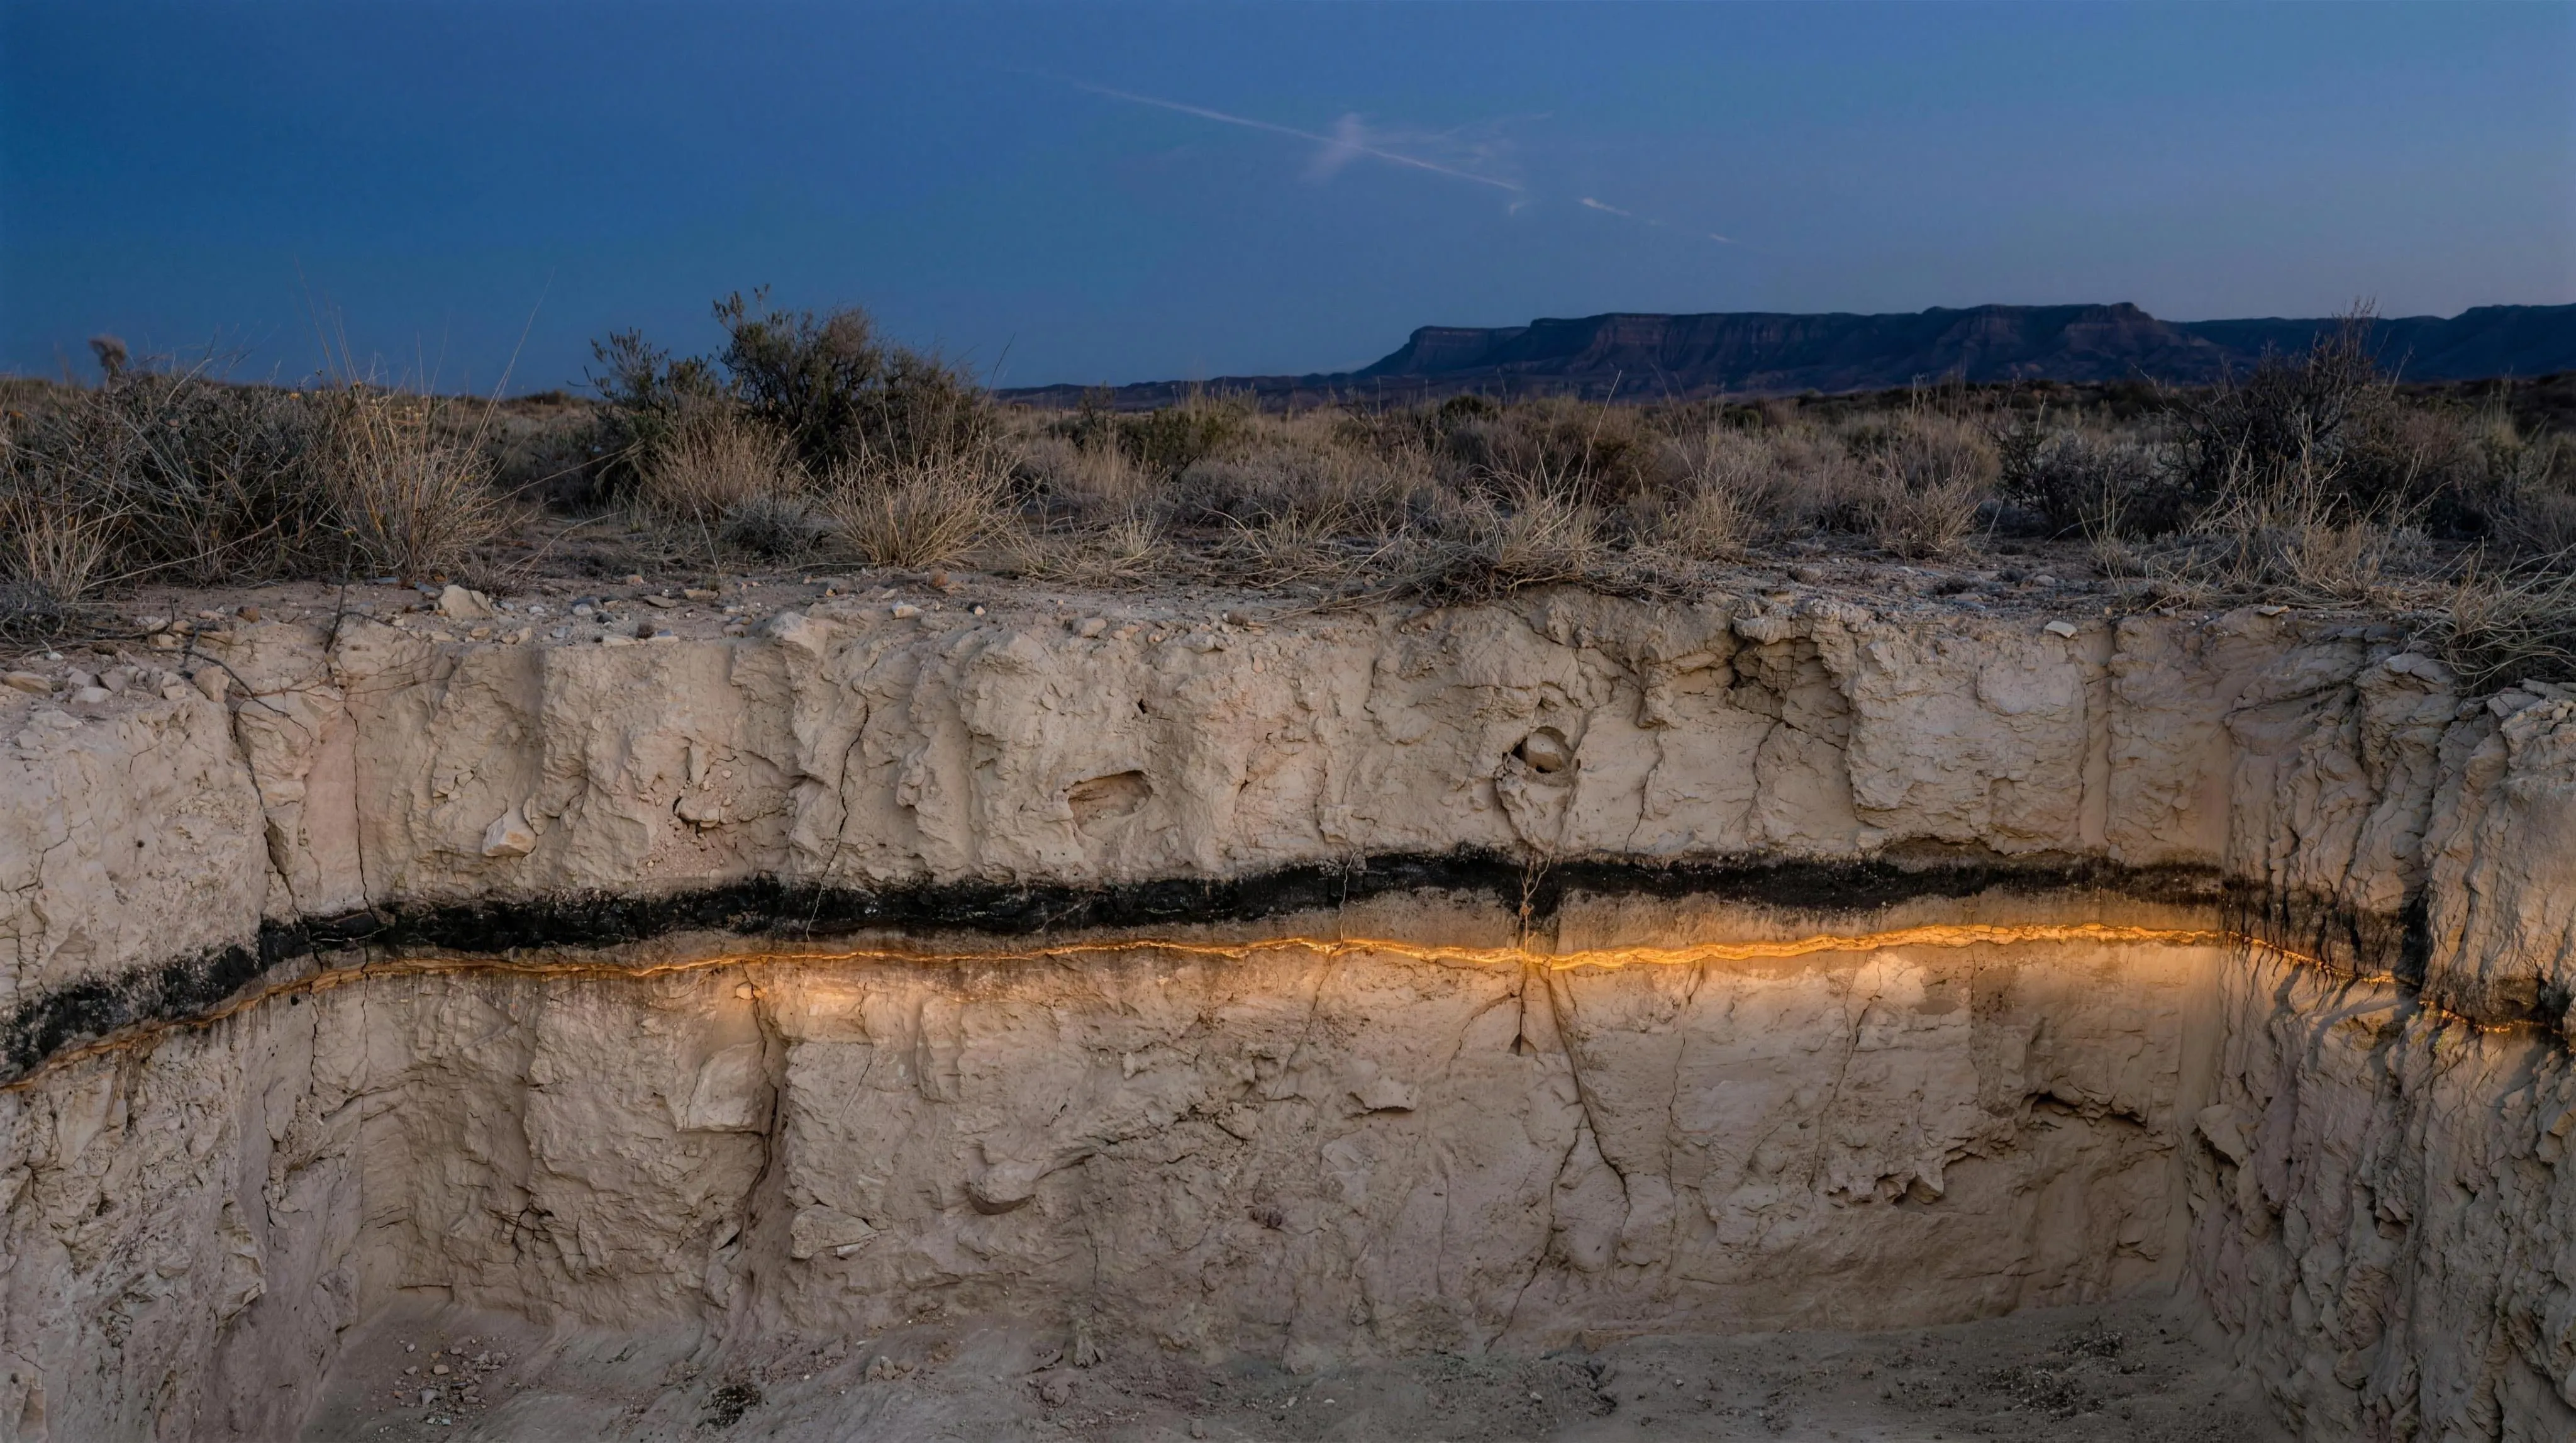 The Younger Dryas Impact Ledger YOUNGER DRYAS · 12.9 KA · INST-46 In 2007, twenty-six authors proposed in PNAS that an impact 12,900 years ago ended the Clovis culture, killed thirty-five genera of megafauna, and tipped the planet into a twelve-hundred-year cold snap. This instrument does not summarise that argument; it runs it. The Layer view puts seventeen sites on one axis: under the proponents' own Bayesian model fifteen of fifteen touch the claimed boundary and the layer looks synchronous across four continents, while switching to ages measured directly on the layer leaves five of eleven, with Lommel's charcoal five hundred years too old and Gainey, which supplied the highest microspherule count ever published, having its carbon spherules dated to about two centuries ago. The Impactor view computes five requirements that must hold at once, all from Collins/Melosh/Marcus 2005: delivering the measured 82.2 ppt platinum spike takes a kilometre of iron, a kilometre of iron leaves a twenty-kilometre crater, shrinking it until the crater could hide drops the platinum by four orders of magnitude, and growing it until it could burn a continent makes it a once-in-thirteen-million-year event. The fifth cannot be bought at any size, because aerosols clear the stratosphere within fifteen years and the stadial lasted 1,193. The Ledger gives all fifteen lines of evidence: the ones that were not reproduced, the ones that turned out not to be unique, the ones refuted, and the two retracted in February 2026. The platinum spike is real and nobody disputes the measurement, and the paper reporting it says in its own words that no such crater has been found, and its lead author now co-authors the refutation. The numbers are sourced, the arithmetic is auditable, and the reading is yours. LIVE
 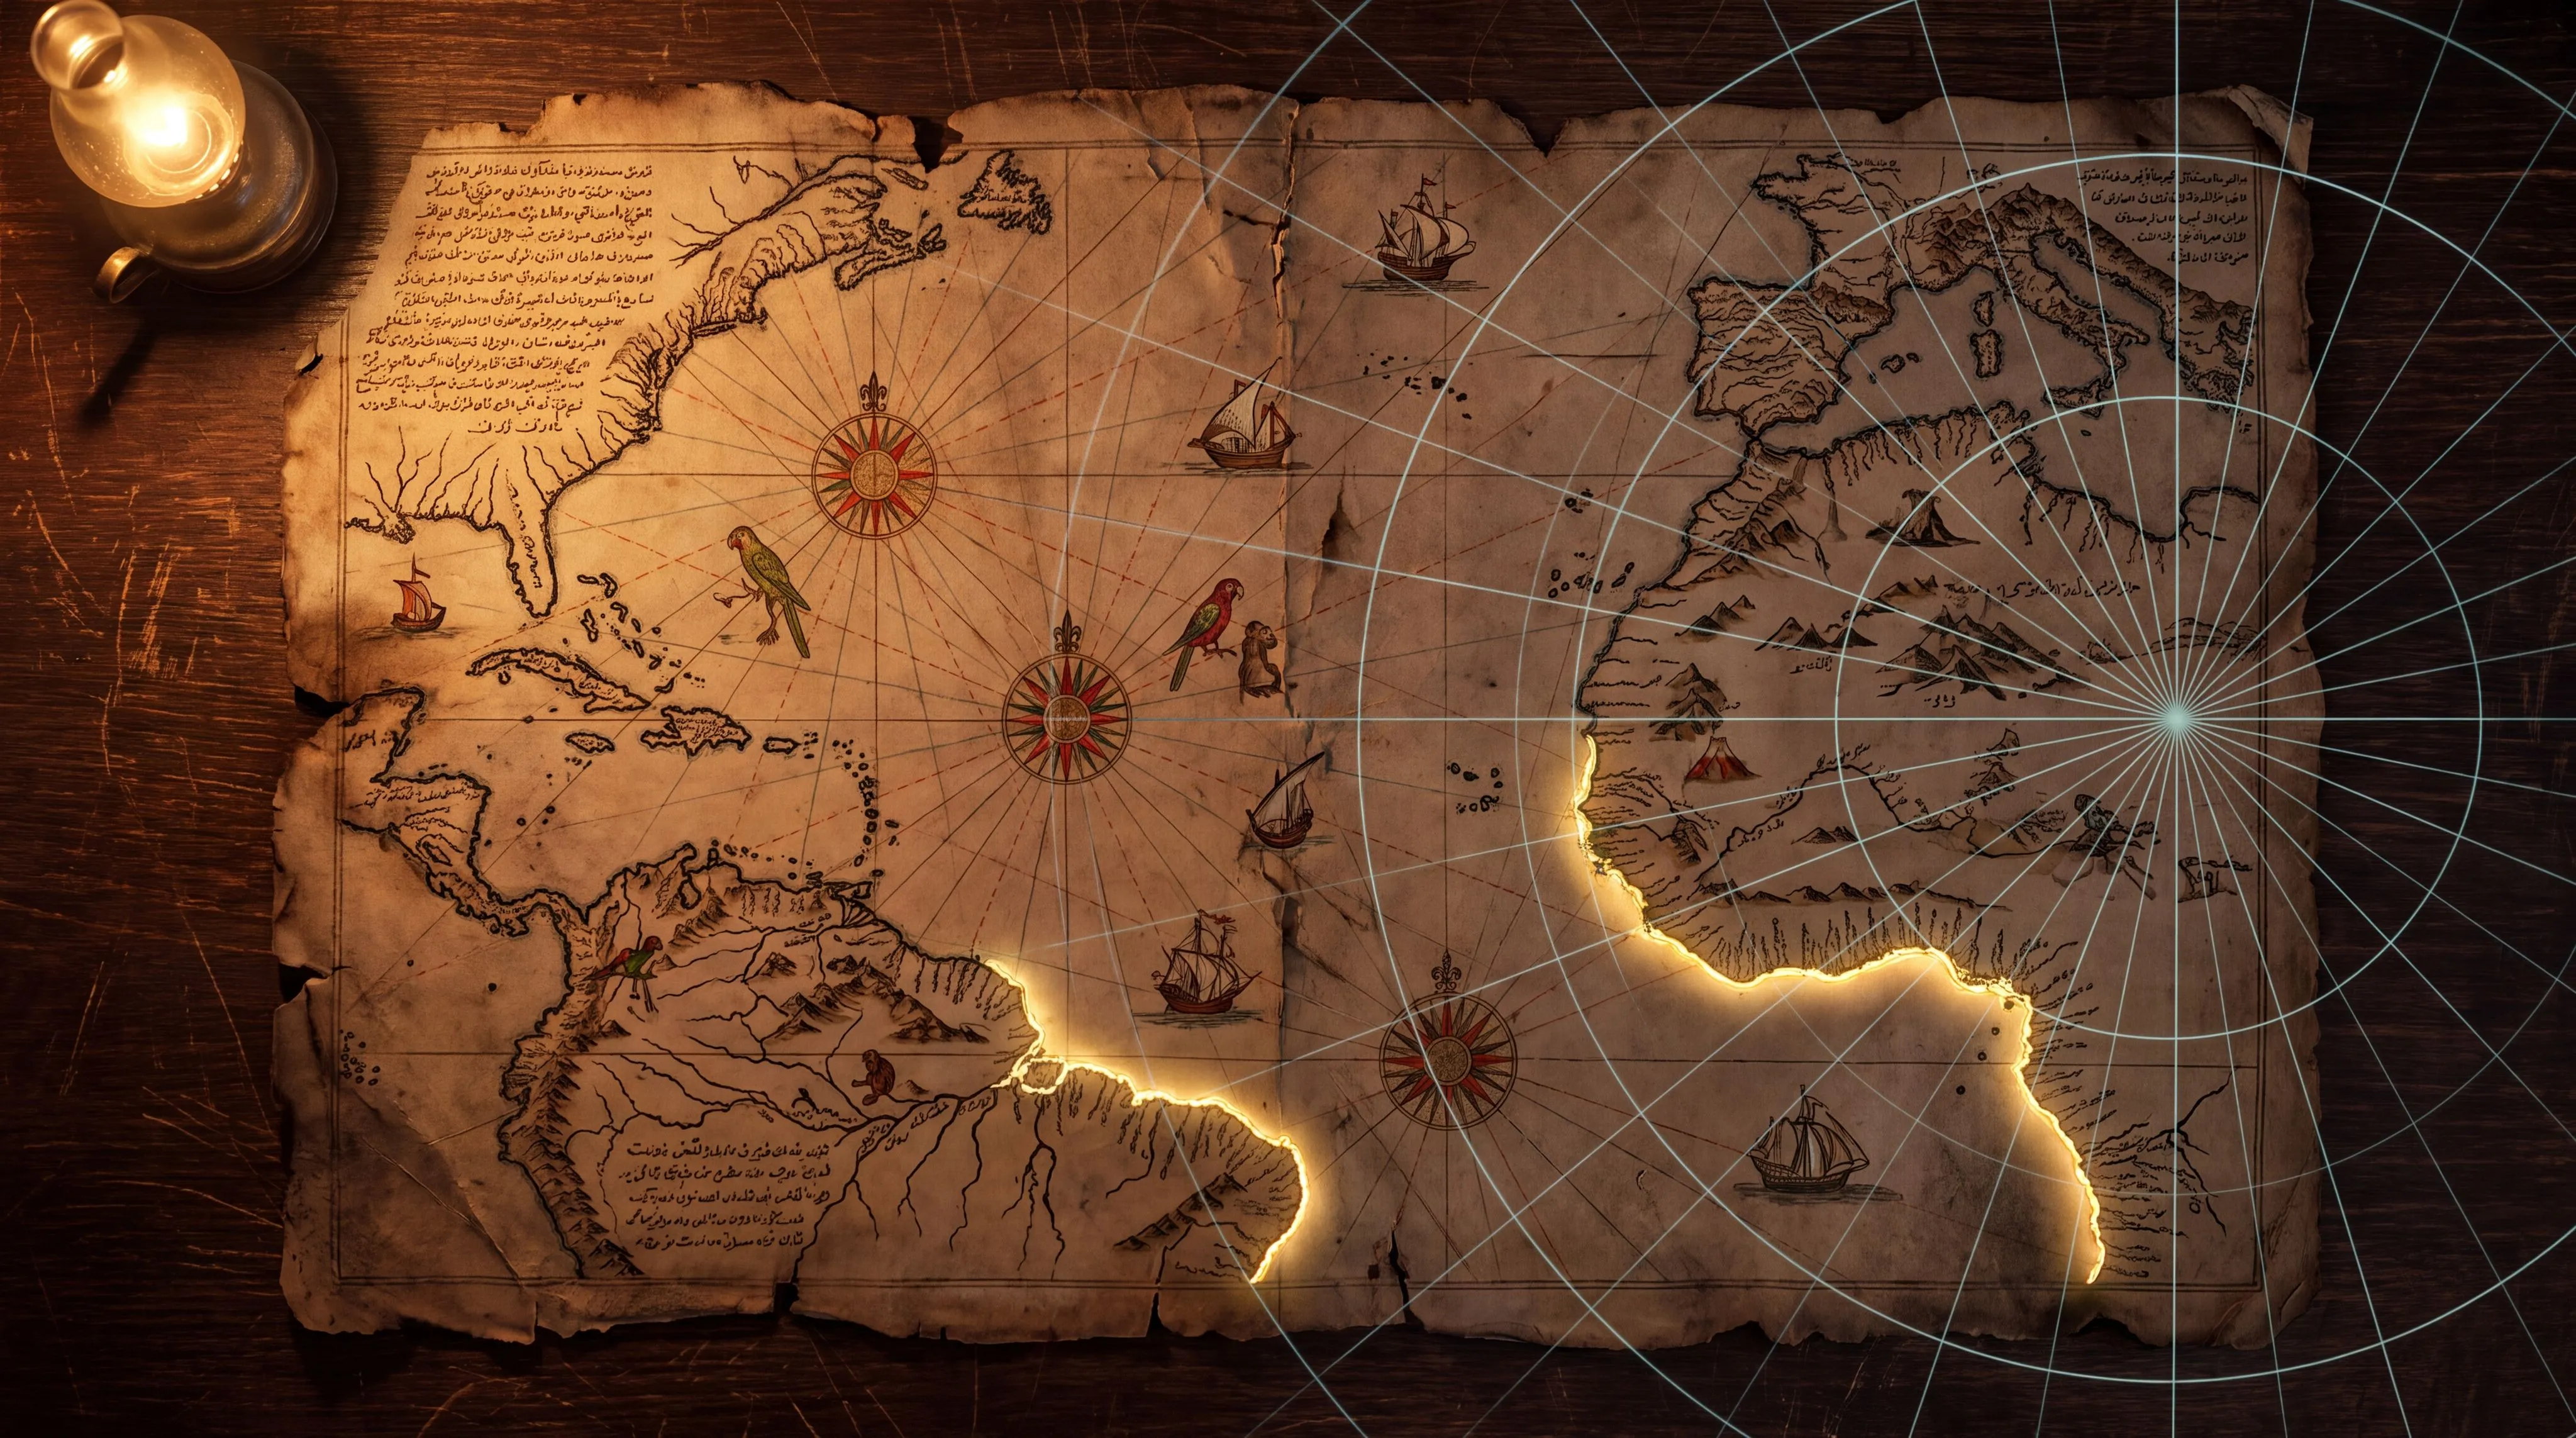 The Piri Reis Map PIRI REIS · 1513 · INST-39 The 1513 Ottoman chart rebuilt as a cartography bench. The Chart view redraws the gazelle-skin fragment with every disputed feature clickable: the Amazon drawn twice, roughly 900 miles of missing coast, the Caribbean drawn to Columbus's cosmography, the southern land annotated with heat and big snakes. The Projection view honestly builds the azimuthal equidistant machine Hapgood claimed, its centre free to stand at Cairo or anywhere: distance and bearing from the centre are exact by construction, and Queen Maud Land falls 11,400 km out in a smeared arc that quarrels with the snug coast the parchment draws against South America. The Southern Land view hands the coast to least squares with three candidates fitted live, subglacial bedrock, the modern ice edge and a Patagonia bent east, RMS printed, the Drake Passage's 800 km gap drawn alongside. The File view lays out 1513 to 2000: Mallery's broadcast, the Ohlmeyer letter, and the Hapgood and McIntosh verdict cards at equal size. The geometry is arithmetic, the claims are sourced, and the reading is yours. LIVE
 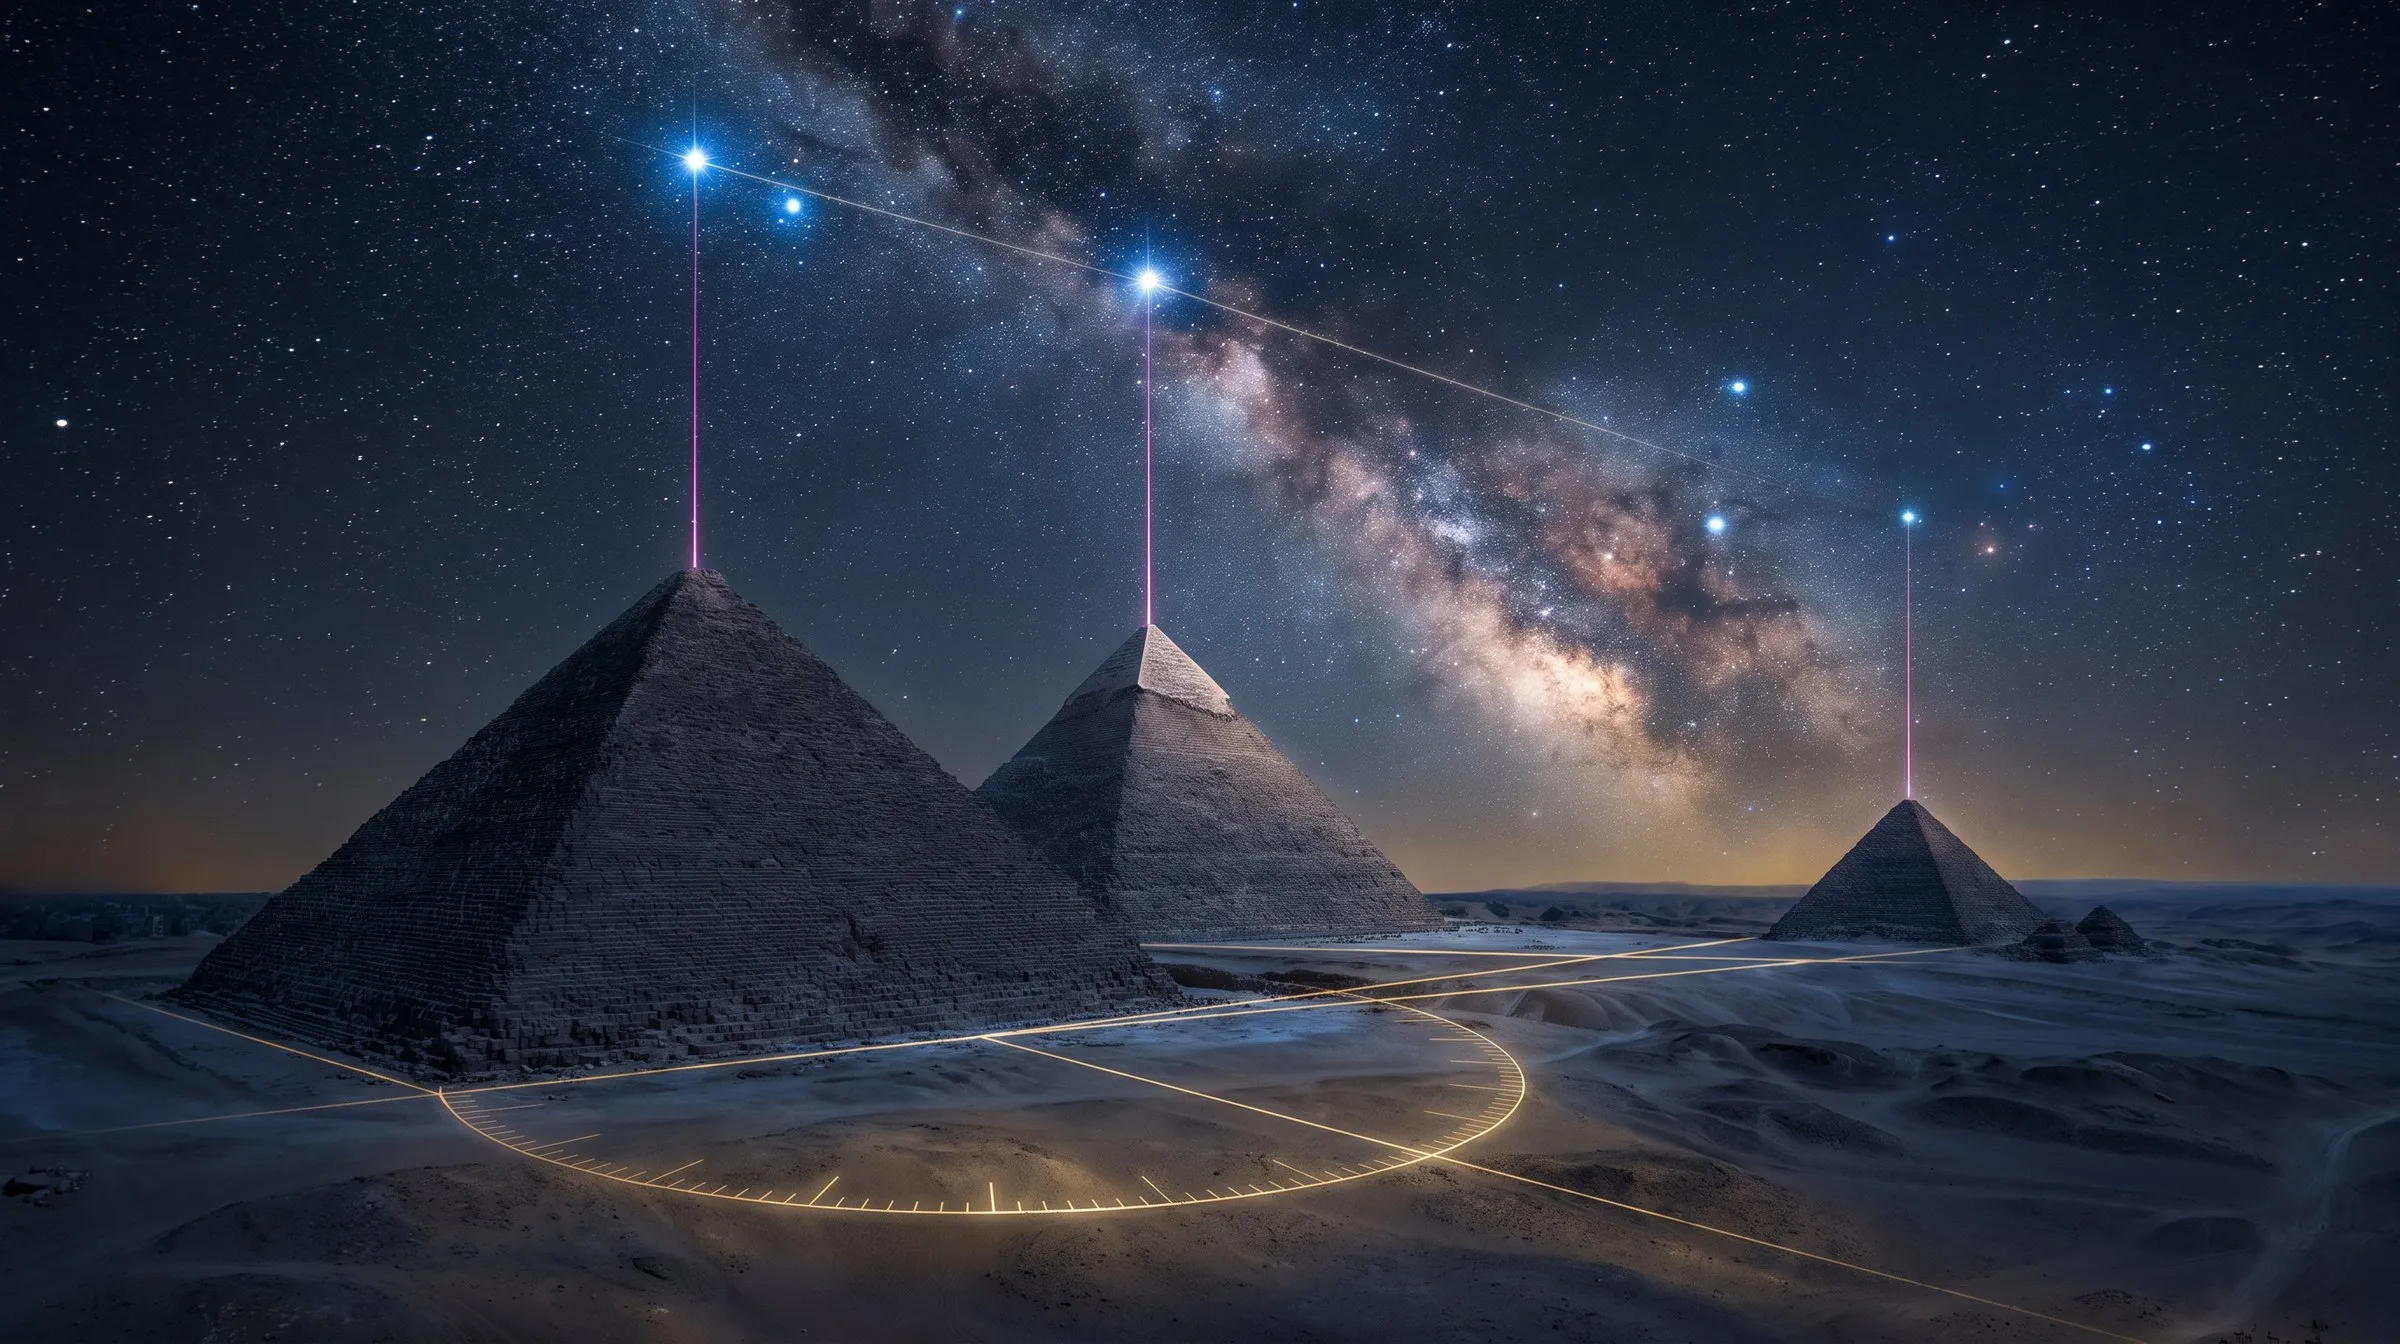 Precession & the Orion Correlation GIZA · PRECESSION · INST-35 Earth's axis rides a 23.4° cone once every 25,772 years, and the whole sky slides against the horizon on that clock, which nobody can wind back or fake. Bauval's famous claim makes that clock its hinge: the three pyramids of Giza map Orion's Belt as it stood at the trough of 10,450 BC. This instrument builds the clock and lets every party make their case on it. The Sky view is a planetarium at Giza with an epoch dial thirteen millennia deep each way; the Match view sets Petrie's survey against the Belt of any epoch, with Krupp's upside-down objection and Fairall's protractor each wired to a switch; the Clock view draws the axis cone and the trough curve that moves under 15 arcminutes per millennium; the Shafts view lets the Great Pyramid's four measured shafts date themselves, clustering at about 2,500 BC. The precession is measured, the claim and the objections are quoted from their sources, and the reading is yours.
The Nazca Construction Bench NAZCA PAMPA · 500 BC–AD 500 · INST-58 The pampa's lines and figures as a construction-arithmetic problem. The Plot view drives the stakes live: centre-line coordinates whose errors refuse to add (RMS = σ at any size), the peg-to-peg chain random-walking to a σ√N closure gap, and the kilometre straightaways held to under two metres by a 1-arcminute naked eye. The Ground view is 3D: from a 1.6 m standing eye through Reiche's ladder, the 13 m Mirador, the bordering rises and the after-check Cessna, with foreshortening read live. The Labour view prices every job at the measured 1984 clearing rate: the hummingbird at a dozen person-days, the whole pampa at ~257 person-days a year across the drawing centuries, and Nickell's 1982 crew of six staking a full-size condor in nine hours. The File view lays out the claims: the runway that began as a joke, Hawkins' 39 hits against 37 free from chance, and the water-and-pathways reading that leads the archaeology. Two verdicts at equal size: the construction never needs the air; why they drew stays open. LIVE Earth's Shifting Crust CRUST DISPLACEMENT · 1958 · INST-57 Charles Hapgood's 1958 hypothesis, with Einstein's foreword, on which Hancock staked a civilisation in 1995: the whole crust can slide 30 degrees in a few thousand years. This instrument runs it at face value. The Globe view replays the claimed slide on a real-coastline Earth: geography moves, the rotation axis and climate rings stay put, Hudson Bay exits the polar circle as Antarctica enters it, and a misfit heat-map prices the rotated shell against the equatorial bulge per pixel, closed form, up to 10.7 km. The Engine view runs the book's own ice-cap motor to the end: the off-axis centrifugal thrust supplies about 900 pascals at its kindest, the pressure of a hand resting on a table, while sliding at the claimed speed demands about 1.4 GPa, a gap of 1.5 million; run forward, the engine buys 0.43 mm a year, pricing the claimed 30 degrees at 7.7 billion years, longer than the age of the Earth. The Records view sets the claim on the rate ladder: every measured motion of the solid Earth reads centimetres per year, the Greenland cores count layer by layer through the claimed dates without a seam, and the Antarctic ice is continuously layered for over 800,000 years. The File walks 1958 to 2015: Einstein's foreword names the only doubtful assumption itself, the author withdraws his own engine in 1970, Hancock switches to the Younger Dryas impact in 2015, and the measured pole drifts toward Hudson Bay today at ten centimetres a year, the claimed direction at one millionth of the claimed rate. Two verdicts at equal size; the reading is yours. LIVE The Osmium Fingerprint FISSURE VS IMPACT · INST-48 INST-46 closed on one undisputed measurement: a platinum spike in Greenland ice that rose a hundredfold over fourteen years, cause unknown. This sequel tries the remaining suspect with the same rigour the impact got: a crack in the ground in Iceland. The Fissure view builds the whole machine at true scale, one unit per kilometre: the famous curtain of fire is a few hundred metres of base, the convective column above it plays against a 9 km subpolar tropopause, about 500 m³/s of column feed clears it, and the three-week channel to Summit, 1,247 km away, is not a model, because Laki demonstrated it in 1783 and Hekla repeated it in 1991, writing a platinum peak into a snow pit at the exact GISP2 site; the control case, Holuhraun, released eleven megatons of SO₂, never topped 4 km, and delivered nothing. The Mixing Bench runs Sun 2020 as a machine: meteorite and mantle are degenerate in the osmium isotope, both near 0.13, but the chondrite fraction that supplies the osmium must deliver iridium at CI proportions, 250 times the measurement, while volcanic gas condensate takes the osmium alone, and the deepest sample at 0.12 sits below anything a chondrite mixture can reach. The Record draws both published tables to the last row: five horizons in four thousand years where an impact predicts one, the 152-154 cm gap shaded rather than smoothed, the disagreeing same-depth replicates in both camps' tables joined in red, and beneath it Abbott 2021's eight bipolar sulfate events, V8 at twice Okmok twenty-five years before the onset, with the platinum spike forty-eight years after it, too late to be anyone's trigger. The File runs 2013 to 2026 in nine cards and two verdicts at equal size: a fingerprint without a culprit, a sheet without a crater. The numbers are sourced, the anchors are re-runnable, and the reading is yours. LIVE The Younger Dryas Impact Ledger YOUNGER DRYAS · 12.9 KA · INST-46 In 2007, twenty-six authors proposed in PNAS that an impact 12,900 years ago ended the Clovis culture, killed thirty-five genera of megafauna, and tipped the planet into a twelve-hundred-year cold snap. This instrument does not summarise that argument; it runs it. The Layer view puts seventeen sites on one axis: under the proponents' own Bayesian model fifteen of fifteen touch the claimed boundary and the layer looks synchronous across four continents, while switching to ages measured directly on the layer leaves five of eleven, with Lommel's charcoal five hundred years too old and Gainey, which supplied the highest microspherule count ever published, having its carbon spherules dated to about two centuries ago. The Impactor view computes five requirements that must hold at once, all from Collins/Melosh/Marcus 2005: delivering the measured 82.2 ppt platinum spike takes a kilometre of iron, a kilometre of iron leaves a twenty-kilometre crater, shrinking it until the crater could hide drops the platinum by four orders of magnitude, and growing it until it could burn a continent makes it a once-in-thirteen-million-year event. The fifth cannot be bought at any size, because aerosols clear the stratosphere within fifteen years and the stadial lasted 1,193. The Ledger gives all fifteen lines of evidence: the ones that were not reproduced, the ones that turned out not to be unique, the ones refuted, and the two retracted in February 2026. The platinum spike is real and nobody disputes the measurement, and the paper reporting it says in its own words that no such crater has been found, and its lead author now co-authors the refutation. The numbers are sourced, the arithmetic is auditable, and the reading is yours. LIVE The Piri Reis Map PIRI REIS · 1513 · INST-39 The 1513 Ottoman chart rebuilt as a cartography bench. The Chart view redraws the gazelle-skin fragment with every disputed feature clickable: the Amazon drawn twice, roughly 900 miles of missing coast, the Caribbean drawn to Columbus's cosmography, the southern land annotated with heat and big snakes. The Projection view honestly builds the azimuthal equidistant machine Hapgood claimed, its centre free to stand at Cairo or anywhere: distance and bearing from the centre are exact by construction, and Queen Maud Land falls 11,400 km out in a smeared arc that quarrels with the snug coast the parchment draws against South America. The Southern Land view hands the coast to least squares with three candidates fitted live, subglacial bedrock, the modern ice edge and a Patagonia bent east, RMS printed, the Drake Passage's 800 km gap drawn alongside. The File view lays out 1513 to 2000: Mallery's broadcast, the Ohlmeyer letter, and the Hapgood and McIntosh verdict cards at equal size. The geometry is arithmetic, the claims are sourced, and the reading is yours. LIVE Precession & the Orion Correlation GIZA · PRECESSION · INST-35 Earth's axis rides a 23.4° cone once every 25,772 years, and the whole sky slides against the horizon on that clock, which nobody can wind back or fake. Bauval's famous claim makes that clock its hinge: the three pyramids of Giza map Orion's Belt as it stood at the trough of 10,450 BC. This instrument builds the clock and lets every party make their case on it. The Sky view is a planetarium at Giza with an epoch dial thirteen millennia deep each way; the Match view sets Petrie's survey against the Belt of any epoch, with Krupp's upside-down objection and Fairall's protractor each wired to a switch; the Clock view draws the axis cone and the trough curve that moves under 15 arcminutes per millennium; the Shafts view lets the Great Pyramid's four measured shafts date themselves, clustering at about 2,500 BC. The precession is measured, the claim and the objections are quoted from their sources, and the reading is yours.